The CAN bench, with Zelos plugged in
The bench from part one with Zelos on it: live plots from another desk, poking the bus, handing a recording to a coworker, and checks that run in CI.
Part 2 of 2 in The CAN bench
Contents8 sections
In part one we built a small CAN bench: a BMS, a DC-DC converter and a VCU running Zephyr in Renode, all from one git repo, on a laptop or a CI machine. It has a bug planted in it. When the BMS cuts the converter's allowance, the defective DC-DC build ramps its current down instead of dropping it.
Part one needed nothing from Zelos. This part puts our tools on the same bench and tours what working on it looks like: watching it live, poking at it, asking questions about it, handing a recording to a coworker, and checking it in CI. The DC-DC bug is what we chase throughout.
What runs on the bench
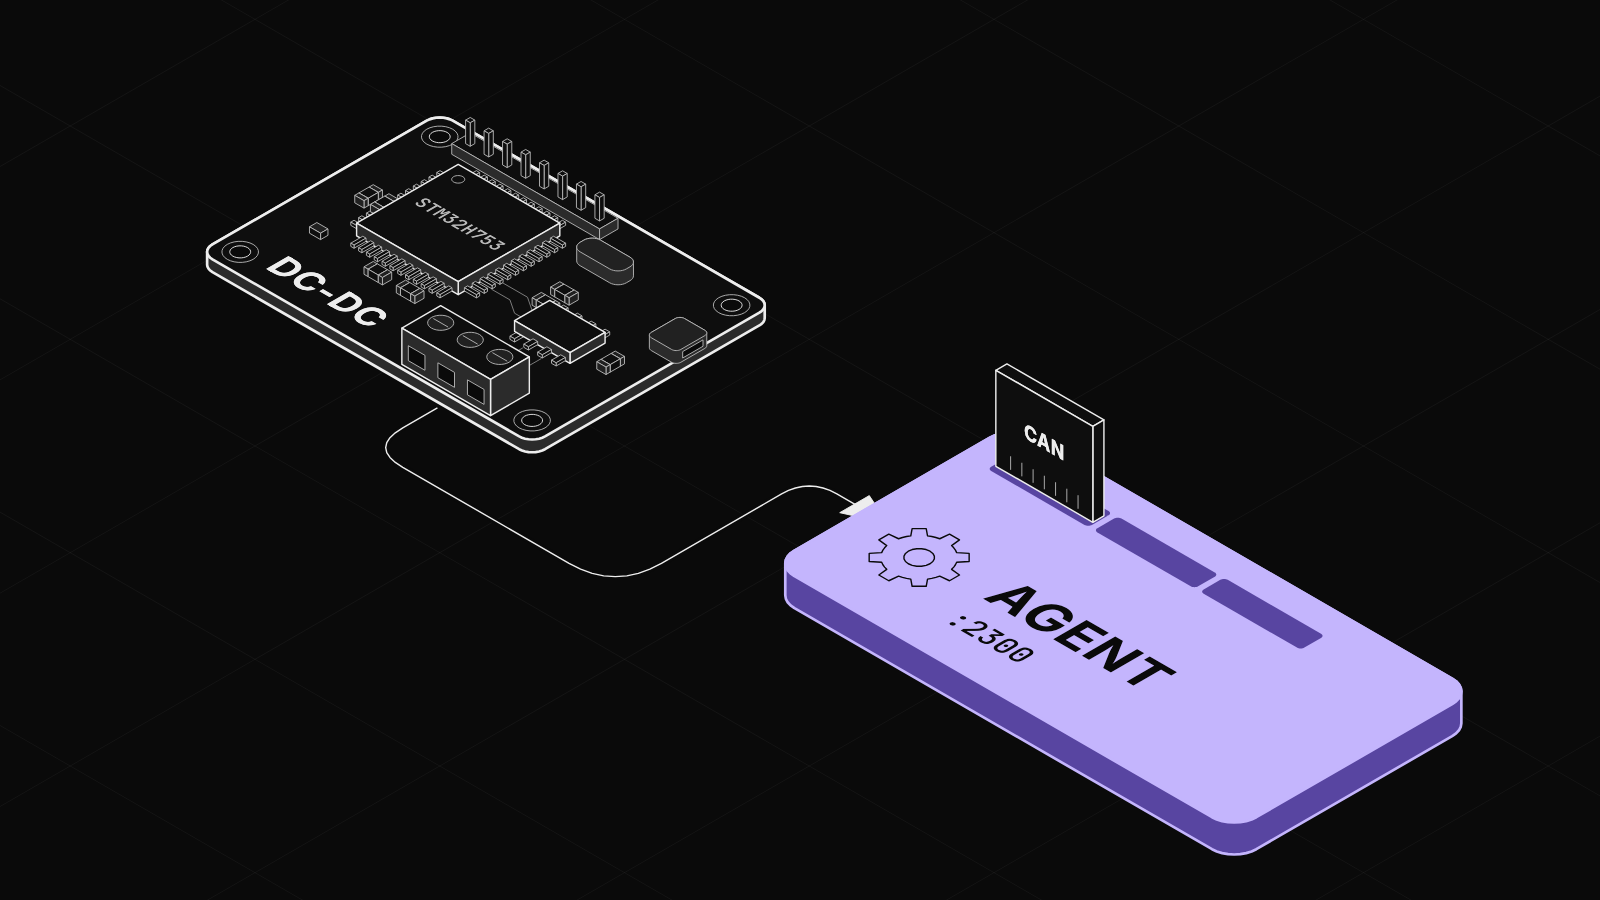
just up starts the same three containers as in part one. The third runs a Zelos agent: a service that takes in signals, stores them and serves them to the app, to notebooks and to anything else that asks.
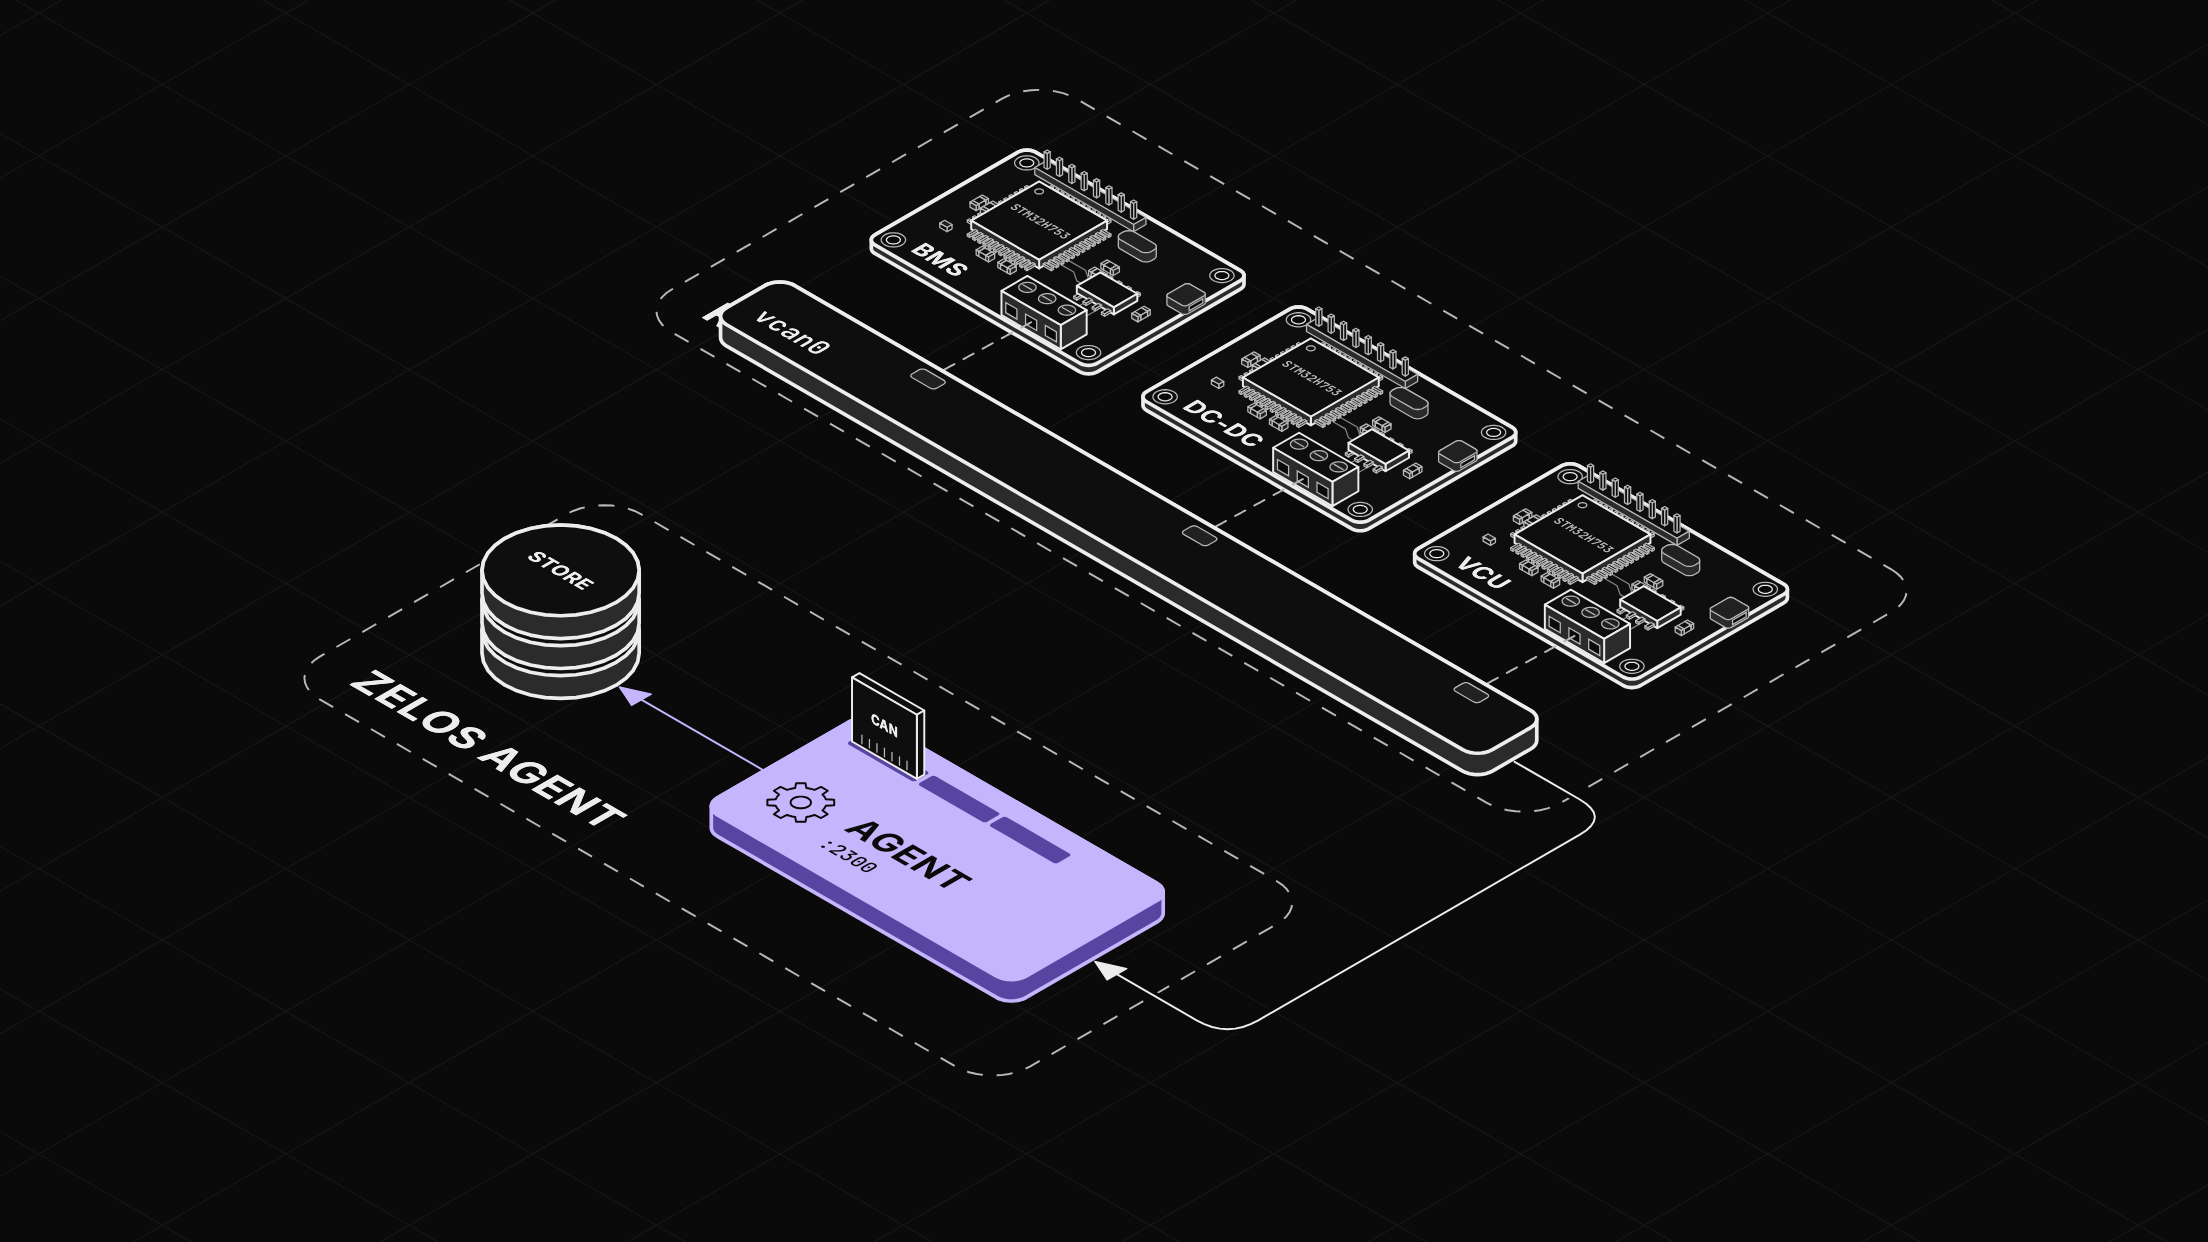
The agent runs our CAN extension as a child process that it starts and restarts. The extension reads vcan0, decodes every frame with the same bench.dbc the firmware is built from, and writes named signals into the agent's store, so you see InputCurrent in amps instead of bytes 4 and 5 of 0x300. On this bench the store keeps the last 15 minutes.
Watching it from another desk
The bench doesn't have to be on your machine. Ours runs on a Linux box in the lab. In the app, New agent in the Data view takes the bench's name, and the bus appears in the Explorer: one folder per message, one signal per field.
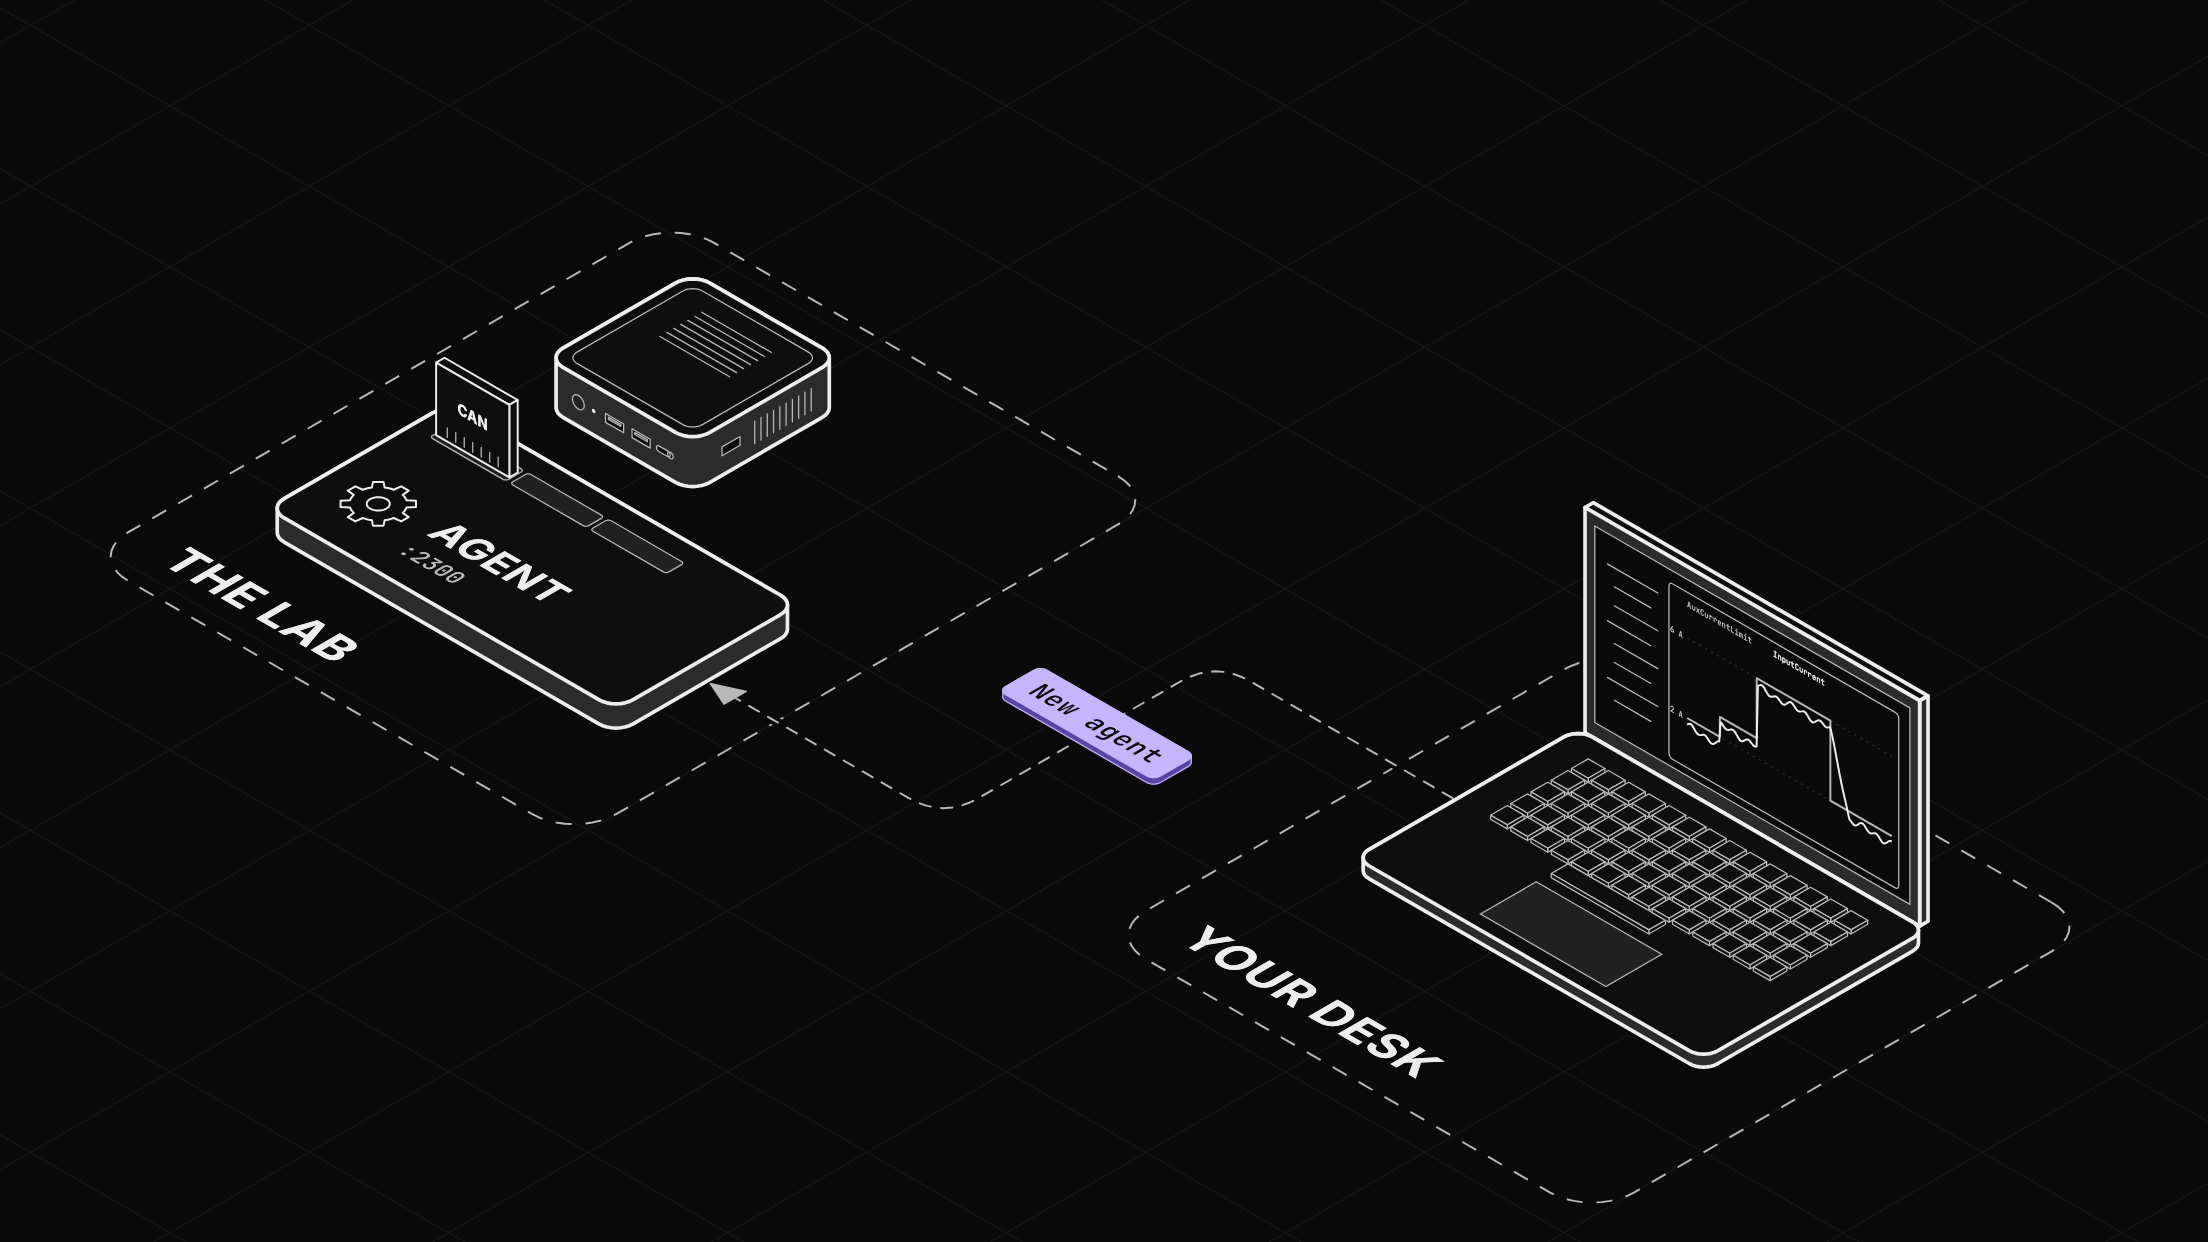
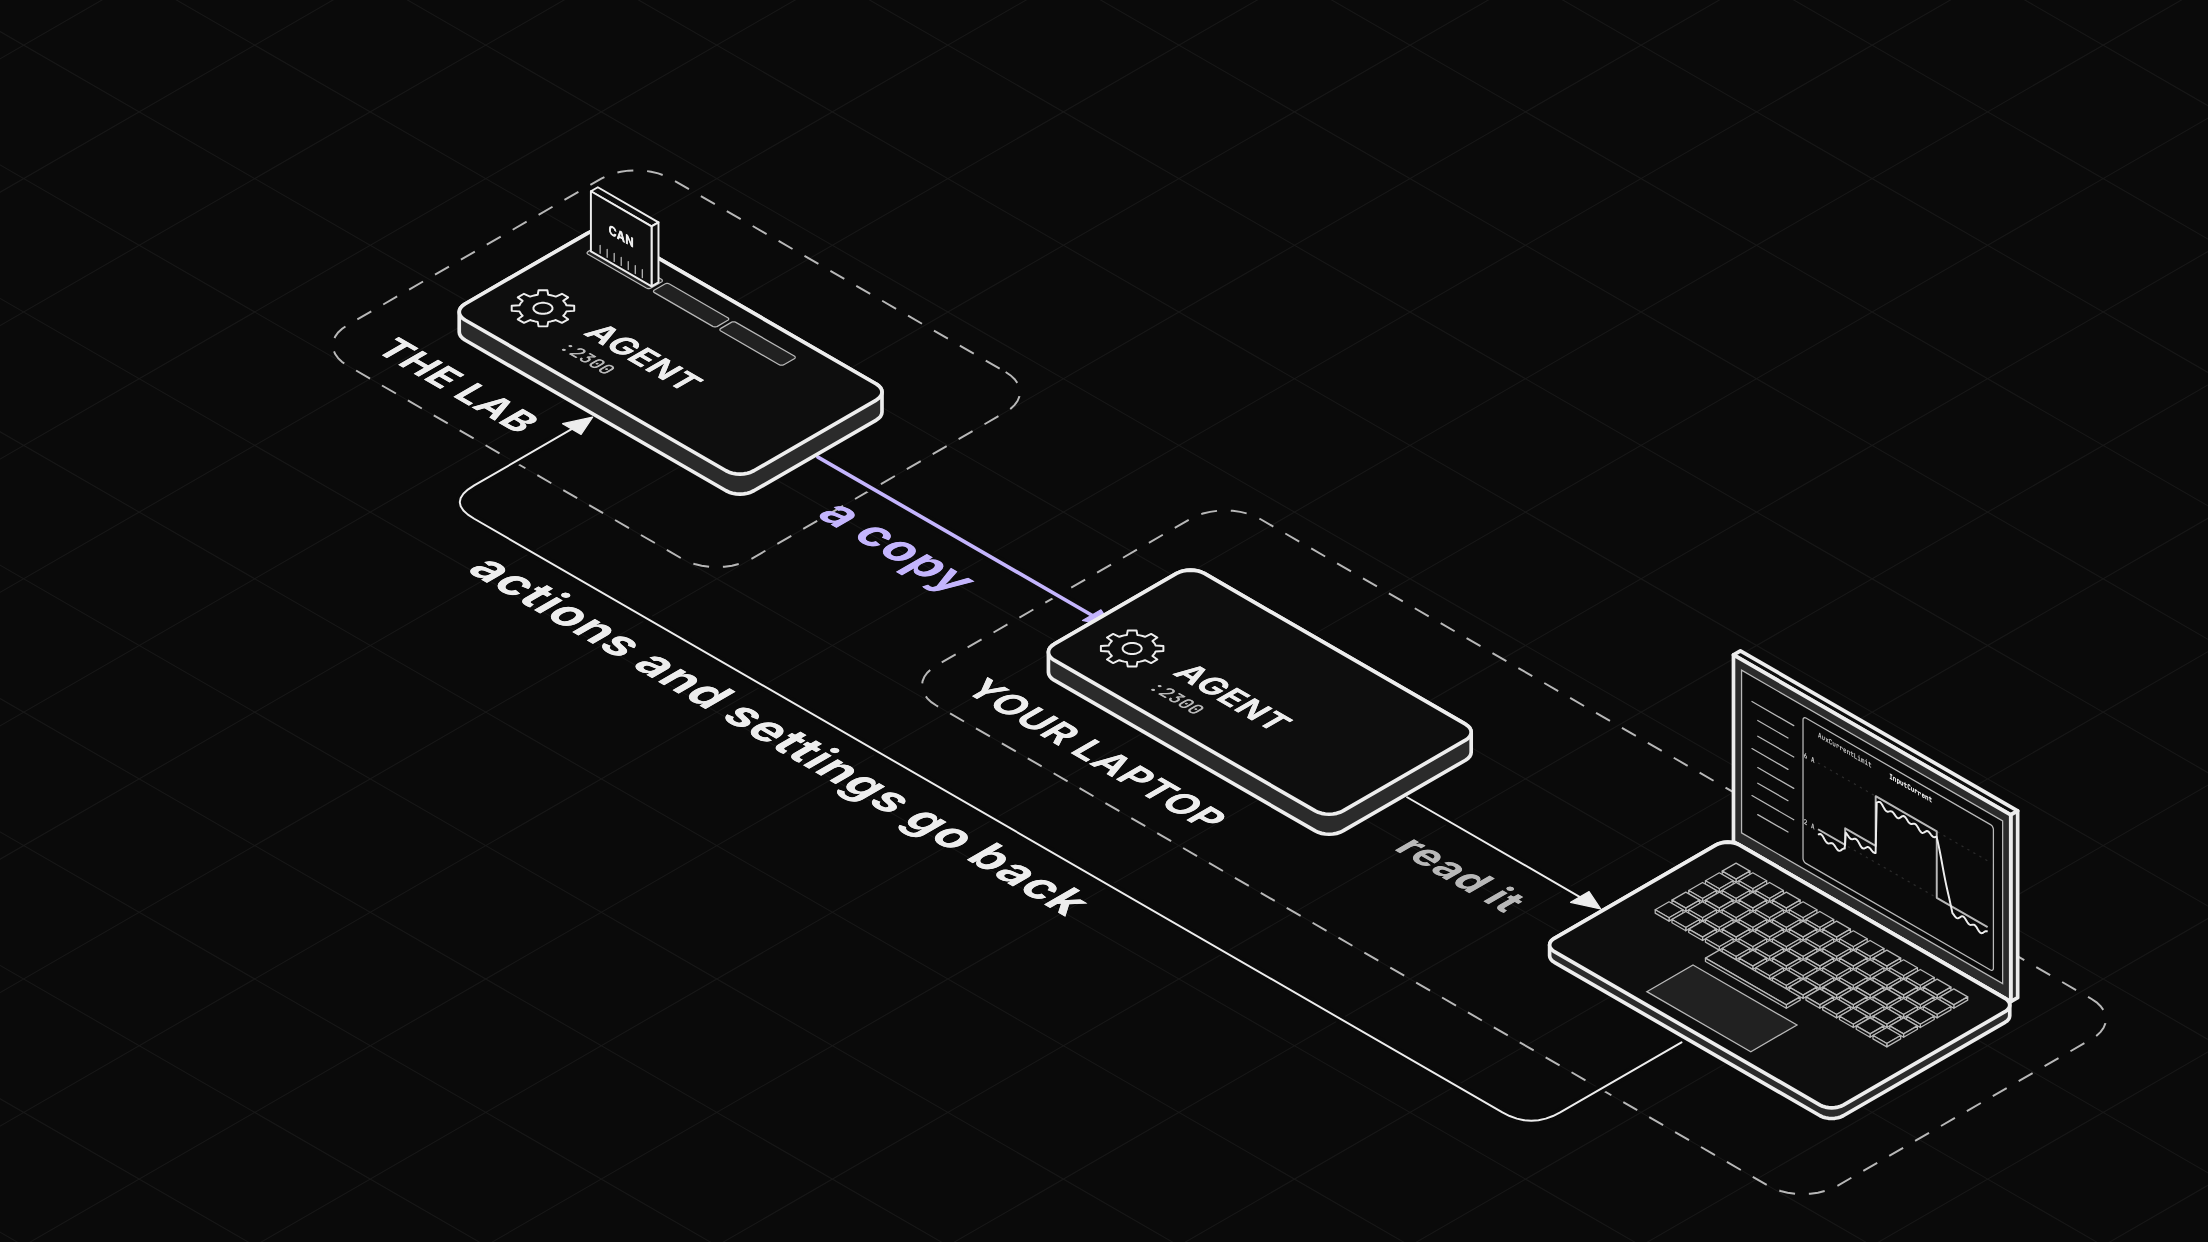
The app runs an agent of its own, and that agent keeps a copy of everything the bench publishes. Plots, checks and notebooks on the laptop read that copy. Actions and extension settings go the other way, to the bench.
Put AuxCurrentLimit and InputCurrent on one plot and you can watch the control loop work. The allowance steps with every mode change, and the draw follows it. Load the defective build, give it a drive cycle, and the bug from part one shows up as soon as charging starts: the allowance drops to 2 A, and the draw walks down after it.
You don't have to build views by hand. Zelos AI, in the app's sidebar, can put one together from a sentence:
Make a DC-DC tab: its draw against the allowance the BMS gives it, the rail voltage, and the converter temperature.
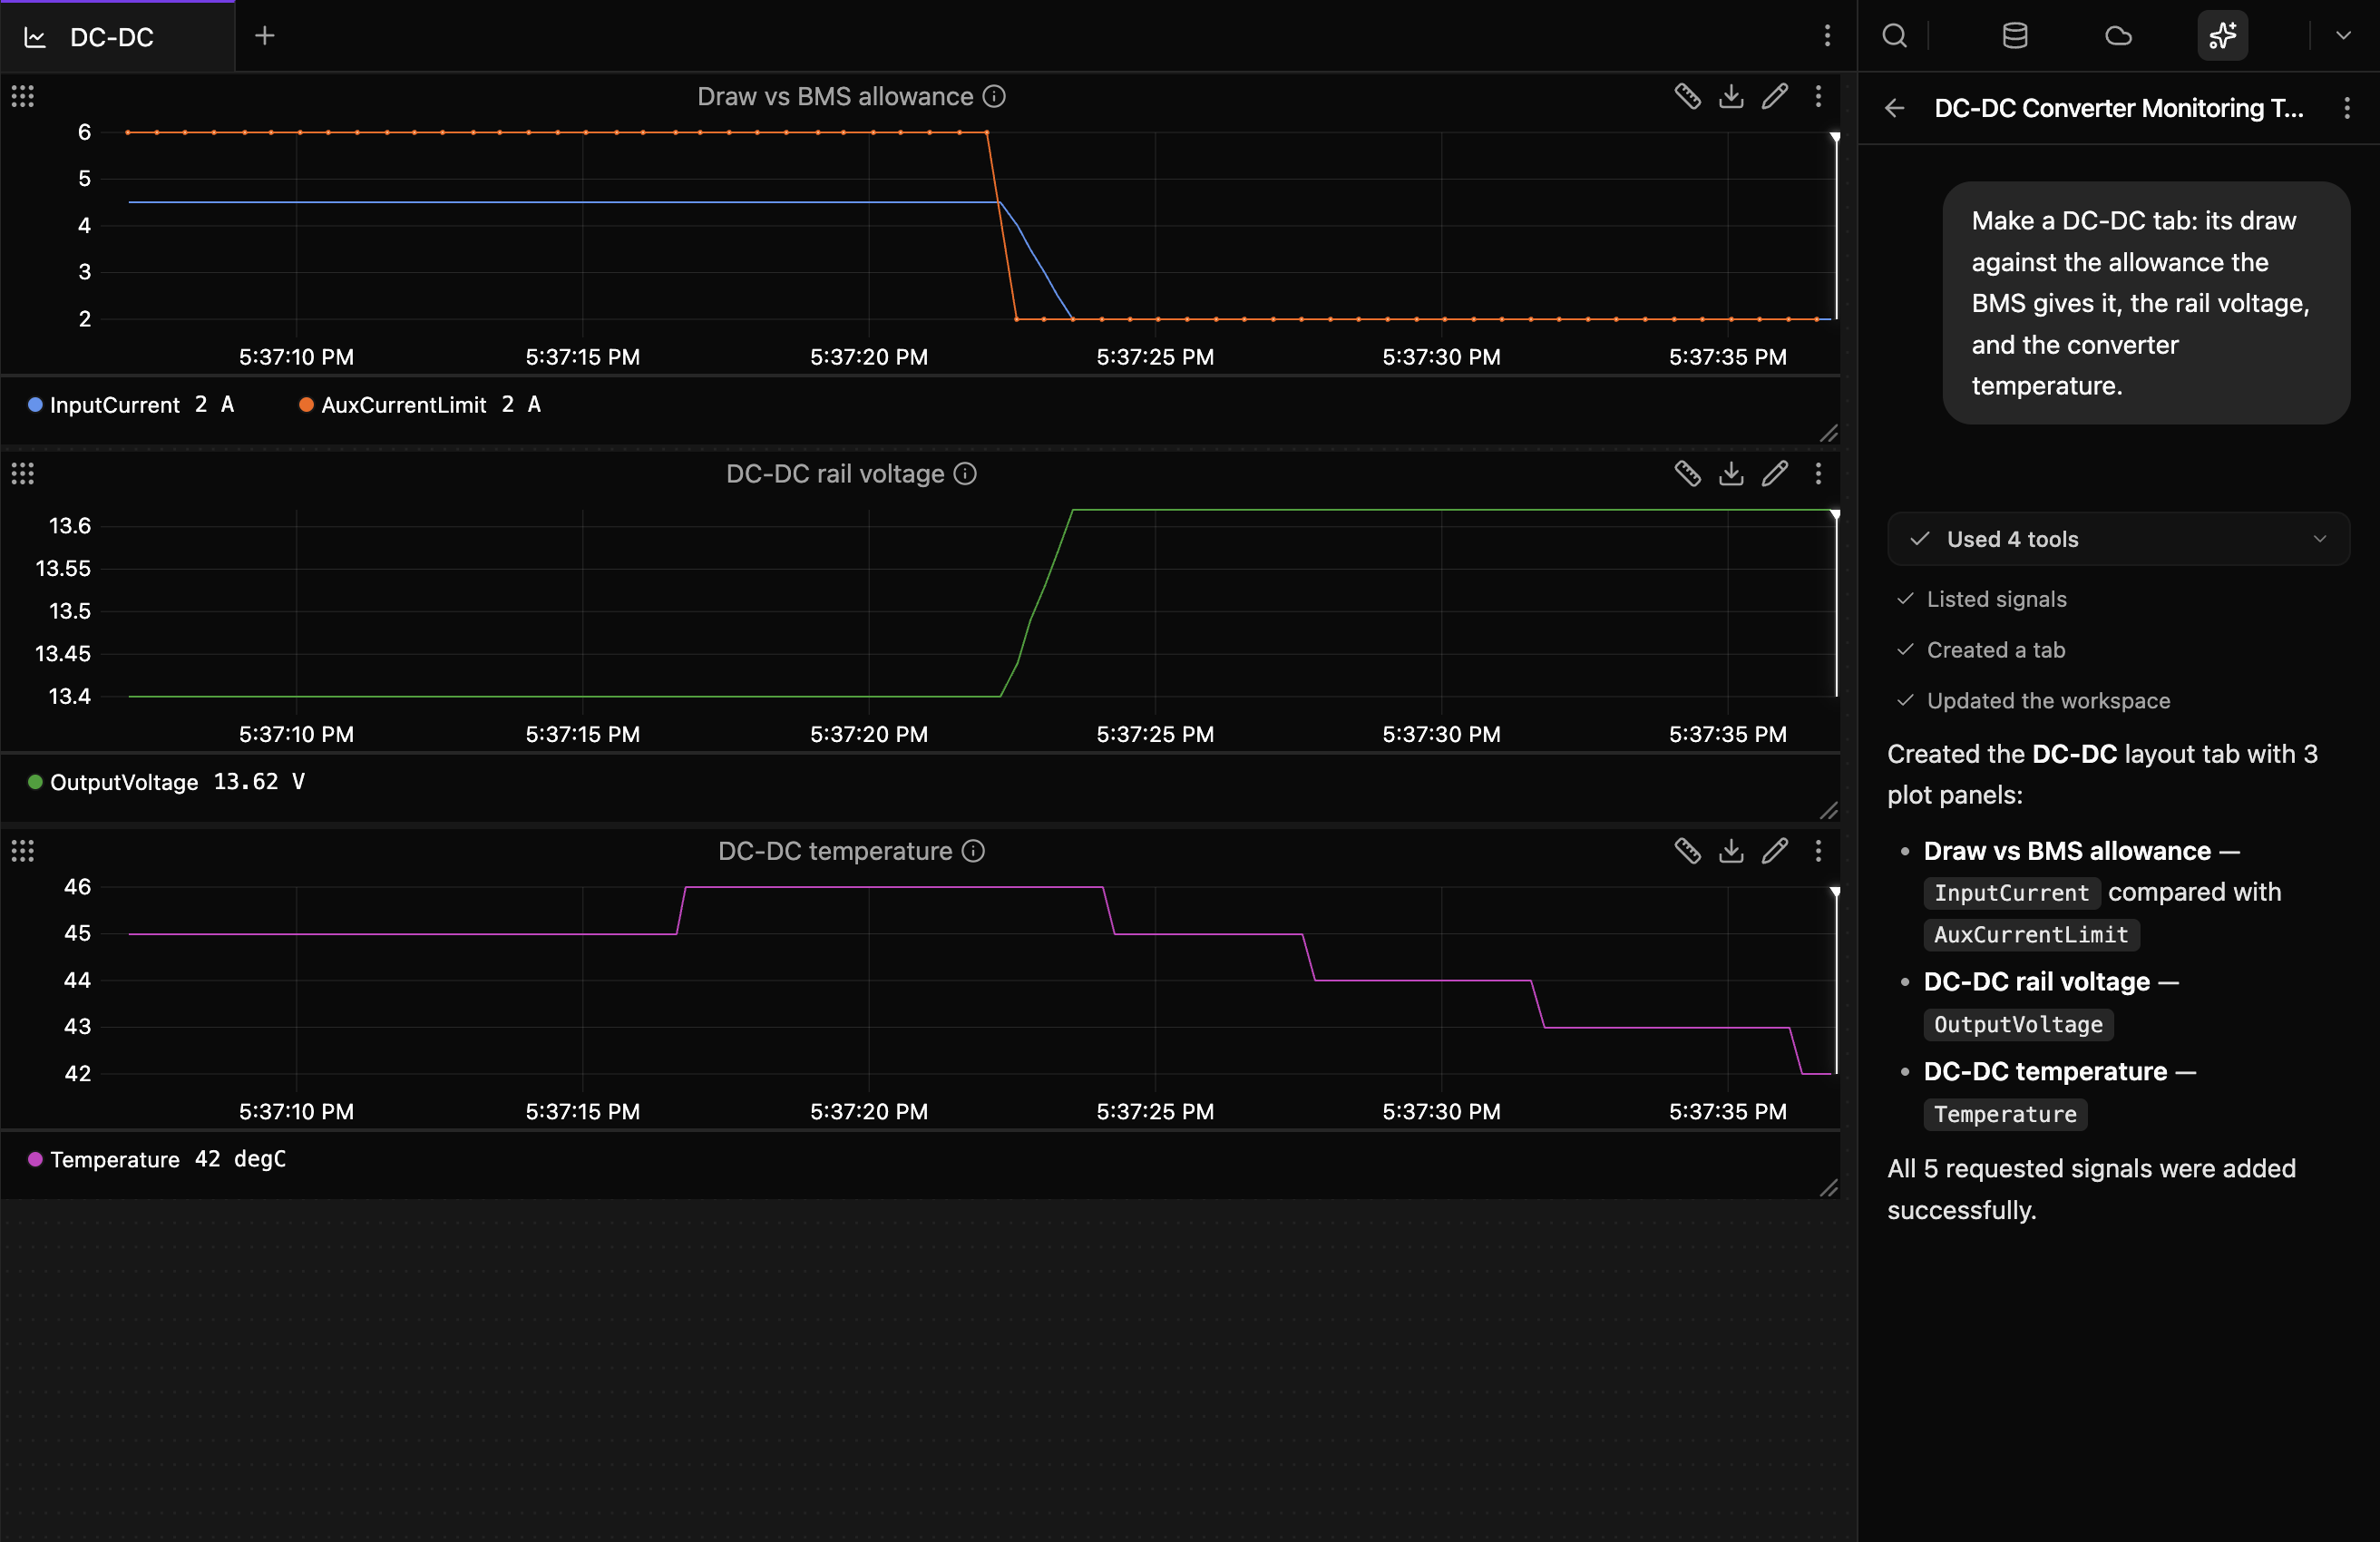
Save the workspace as a shared layout from Layouts in the Data view, and a coworker who connects to the same bench can load the same view.
Asking what happened
The same assistant can read the data for you. Zelos AI reaches its model through Zelos Cloud, so it needs you signed in, and the model sees the results of the tools it calls. Those tools run in your app and agents. Reading data and building plots happen straight away; anything that runs code, sends a frame or changes a setting asks first. With the defective build running, we asked it:
After each cut in the DC-DC's allowance, how long does its draw stay above the new limit?
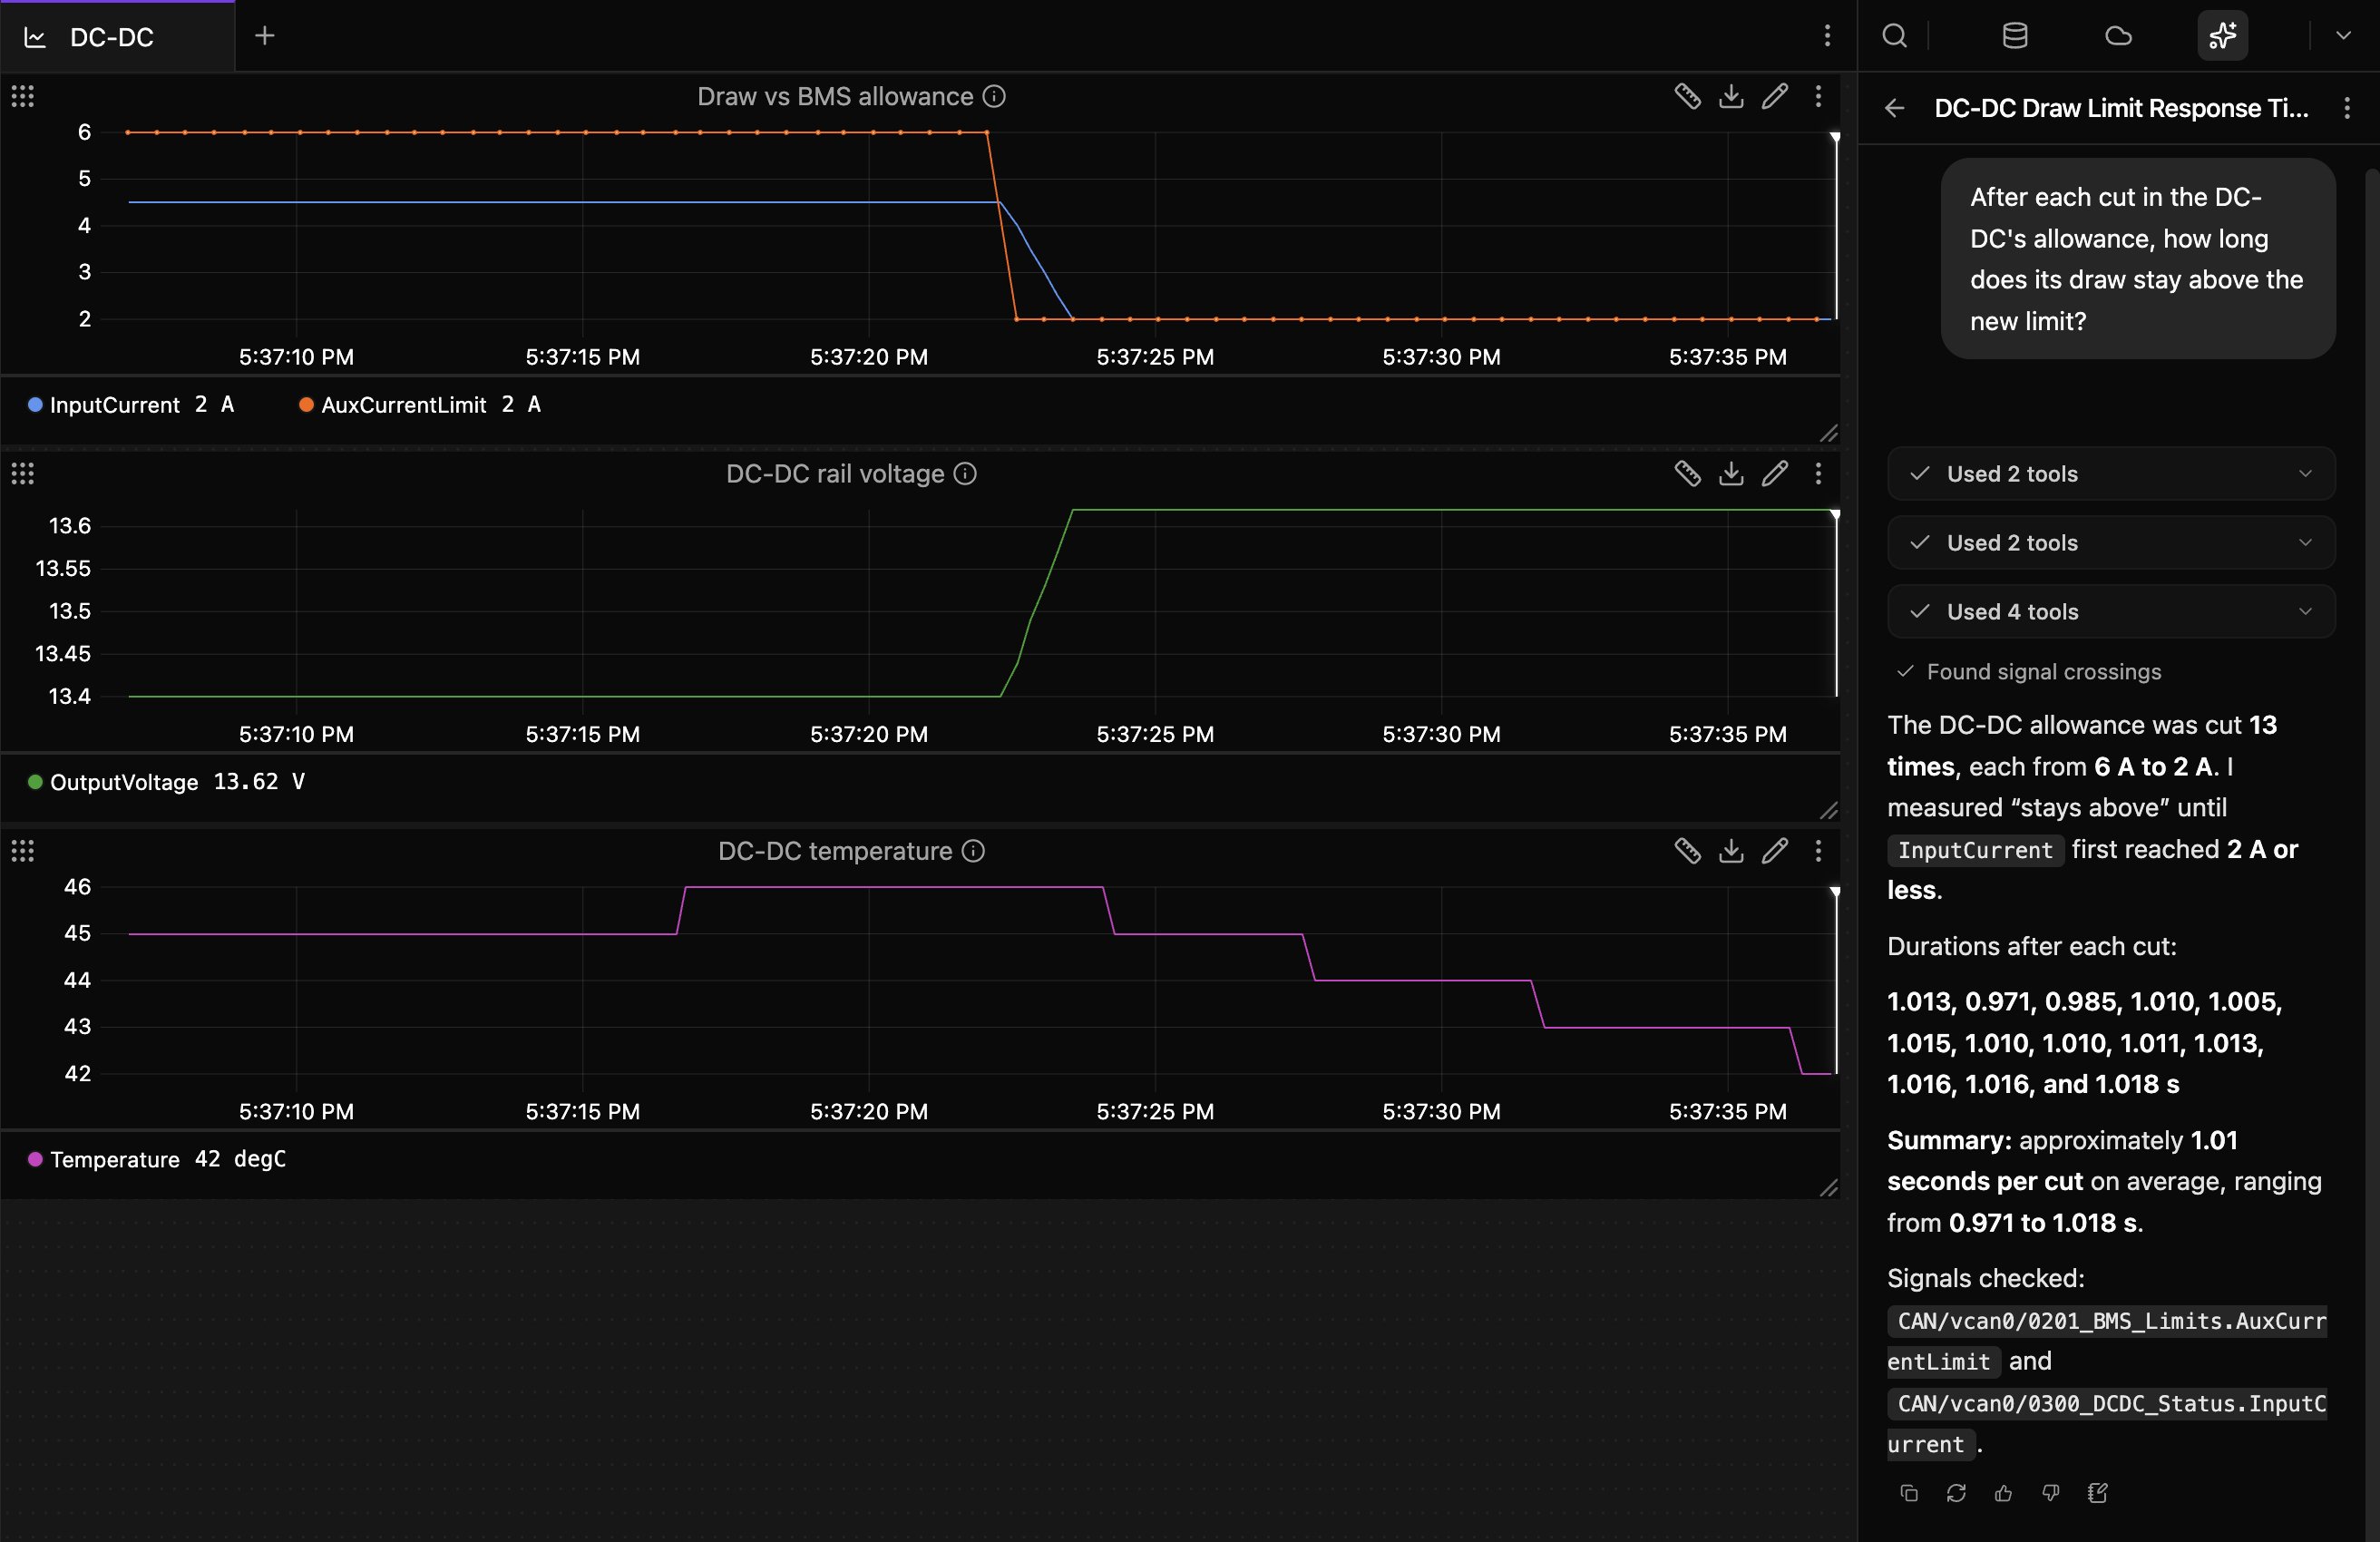
It found 13 cuts in the laptop's copy, measured each one, and said which signals it compared and where it put the threshold. We checked with our own script on the same data and got the same 13 durations.
Poking the bus
The CAN extension ships its own actions: send a frame, start or stop a periodic one, look up a message in the DBC, and a few more. They appear under Actions in the Explorer, and dropping one into an Action panel gives you a form for it. Zelos AI can call them too, and it asks before anything that sends a frame.
CAN Transmit is a separate app extension in the marketplace: a frame composer built on those same actions. Pick a message from the DBC, fill in its signals and save the row, then send it once or start it on a period.
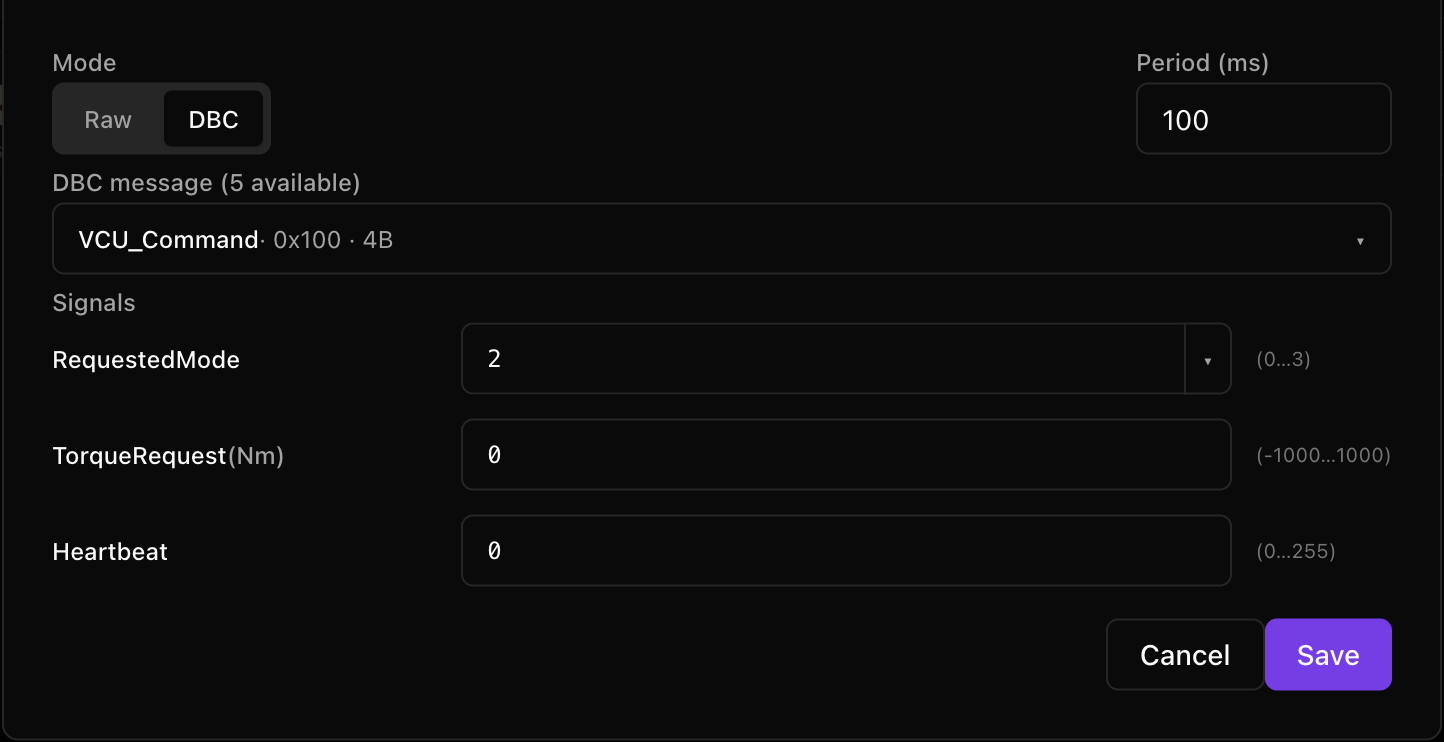
A frame you send goes onto the bus like any other. The VCU keeps sending its own command every 100 ms, though, so a one-off VCU_Command holds only until the next one.
Handing a recording to a coworker
Say you've caught the bug and want someone else to look at it. Save trace in the timeline captures the time range you have selected; the app calls a recording a trace. Export writes it to a single .trz file, and Upload puts it in your organization's library in Zelos Cloud, with a link only members of your organization can open.
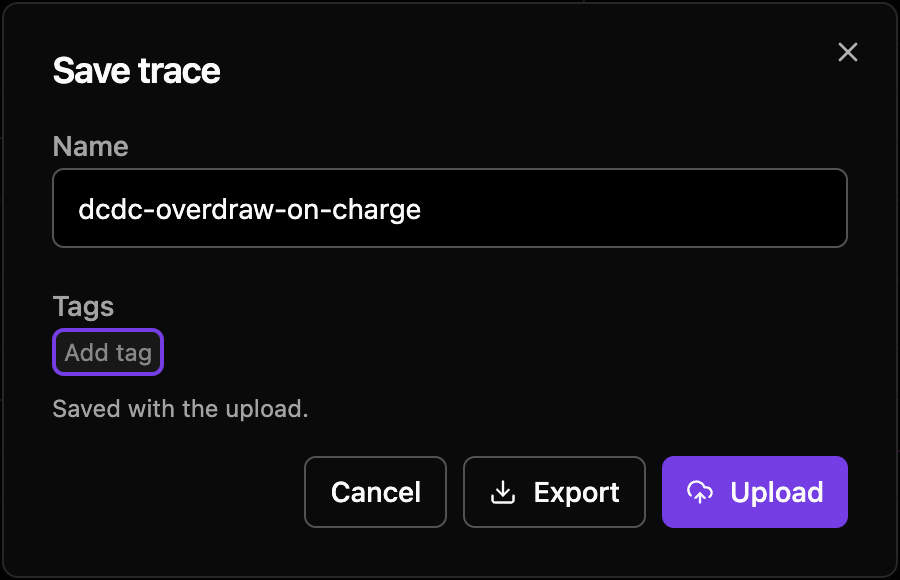
A recording opens in the app like the live bench does, and the same layouts work on it, so the person you send it to doesn't need the bench at all.

Checks that run in CI
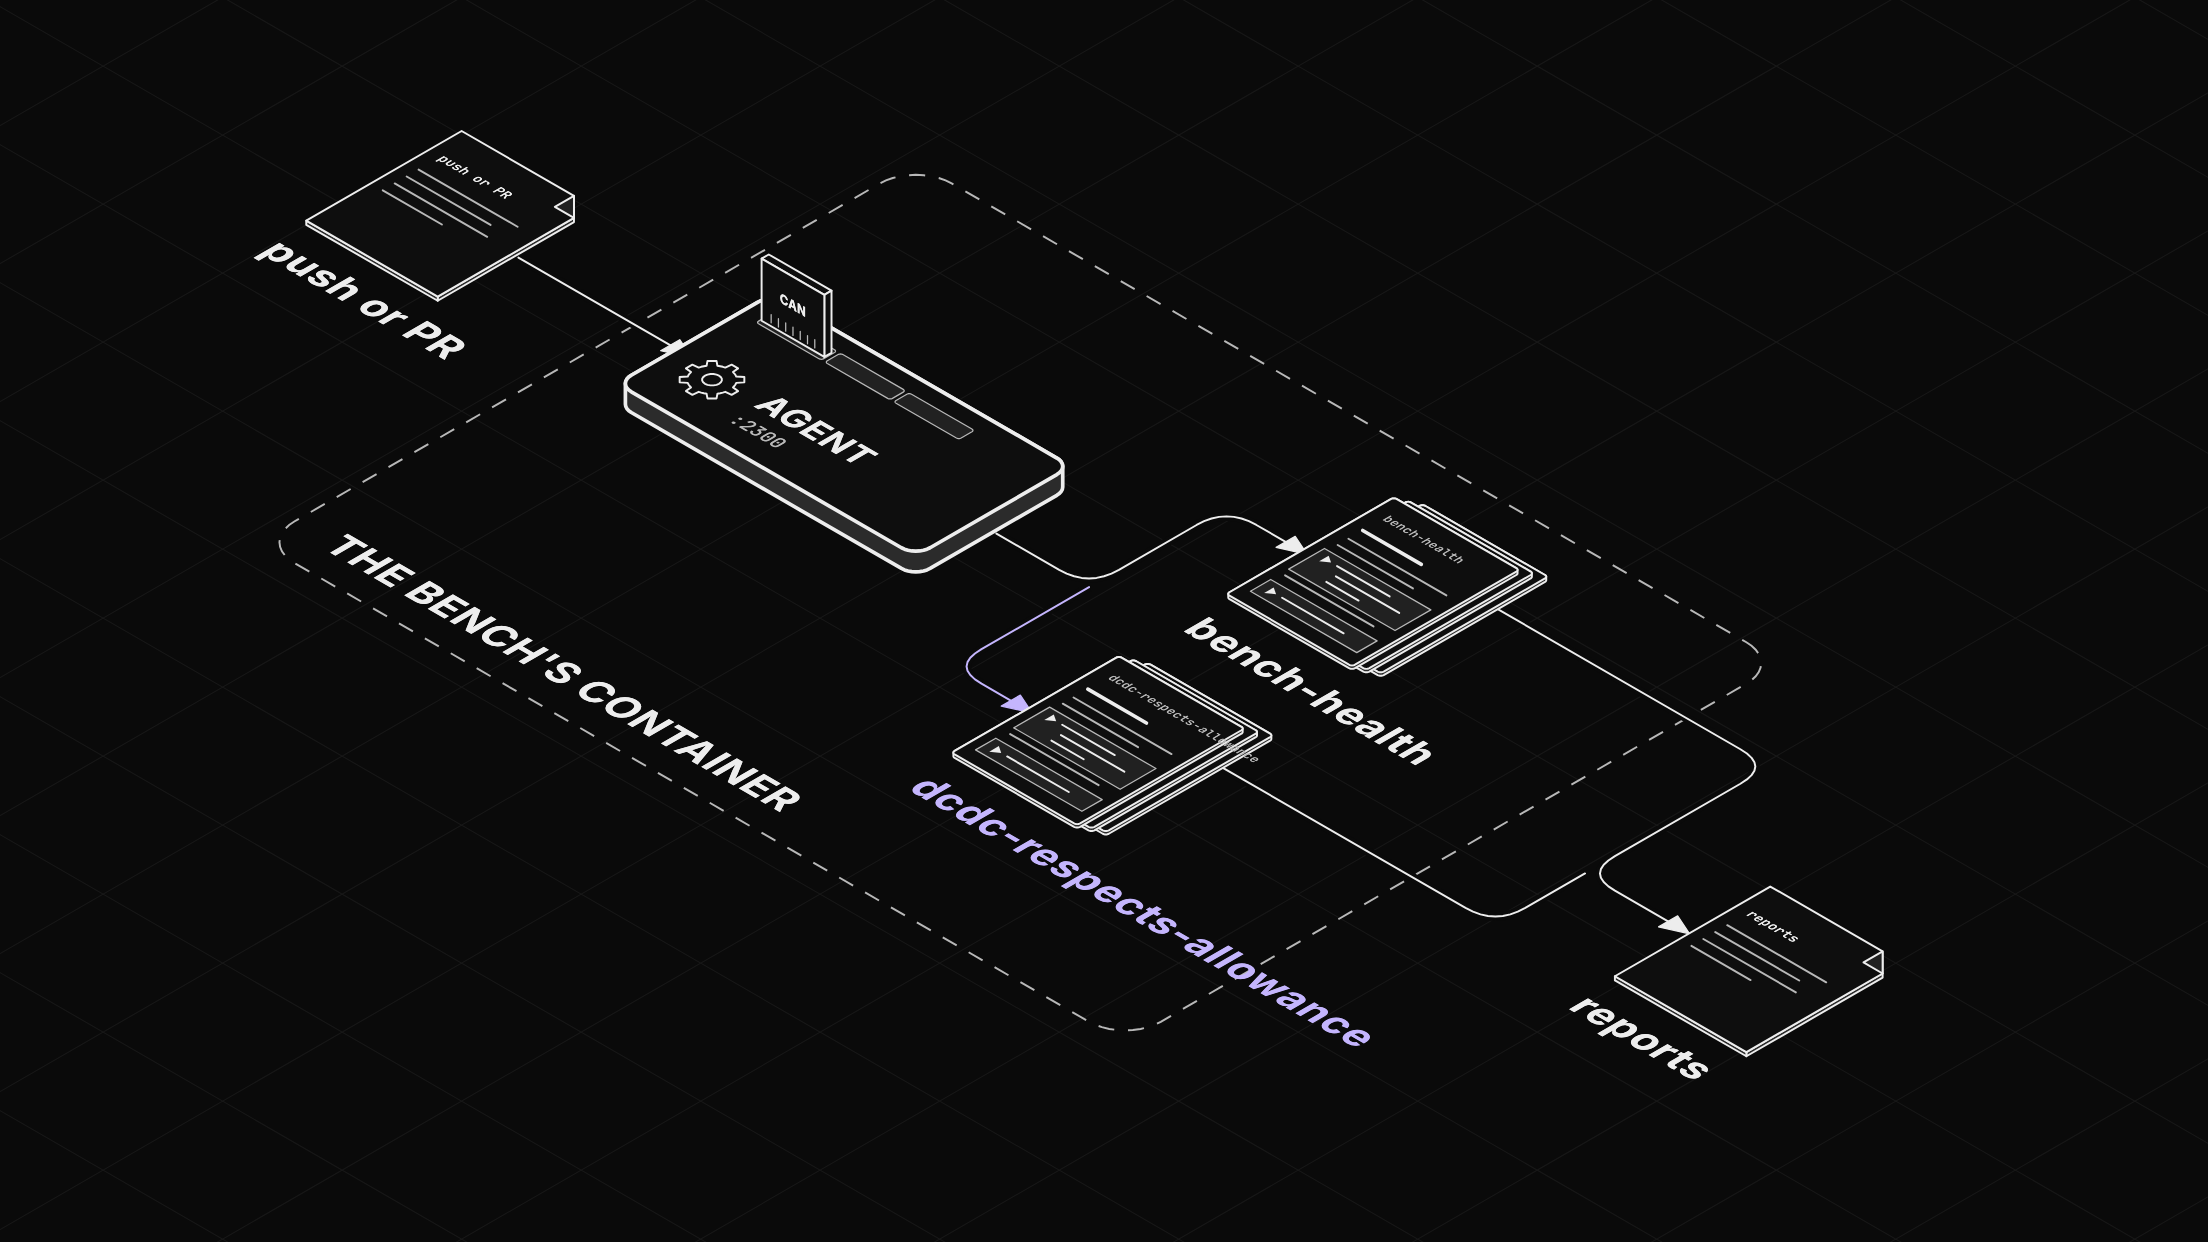
For the things that should always hold, the repo has two notebooks: Markdown files with Python cells, which an agent runs. bench-health checks that every node is still sending and that its values make sense. dcdc-respects-allowance checks that the converter stays under the allowance the BMS gives it, allowing for a sample or two already in flight when the allowance drops.
Clone the repo, open a notebook in the app, and it runs on the laptop's own agent, reading the bench through its copy:
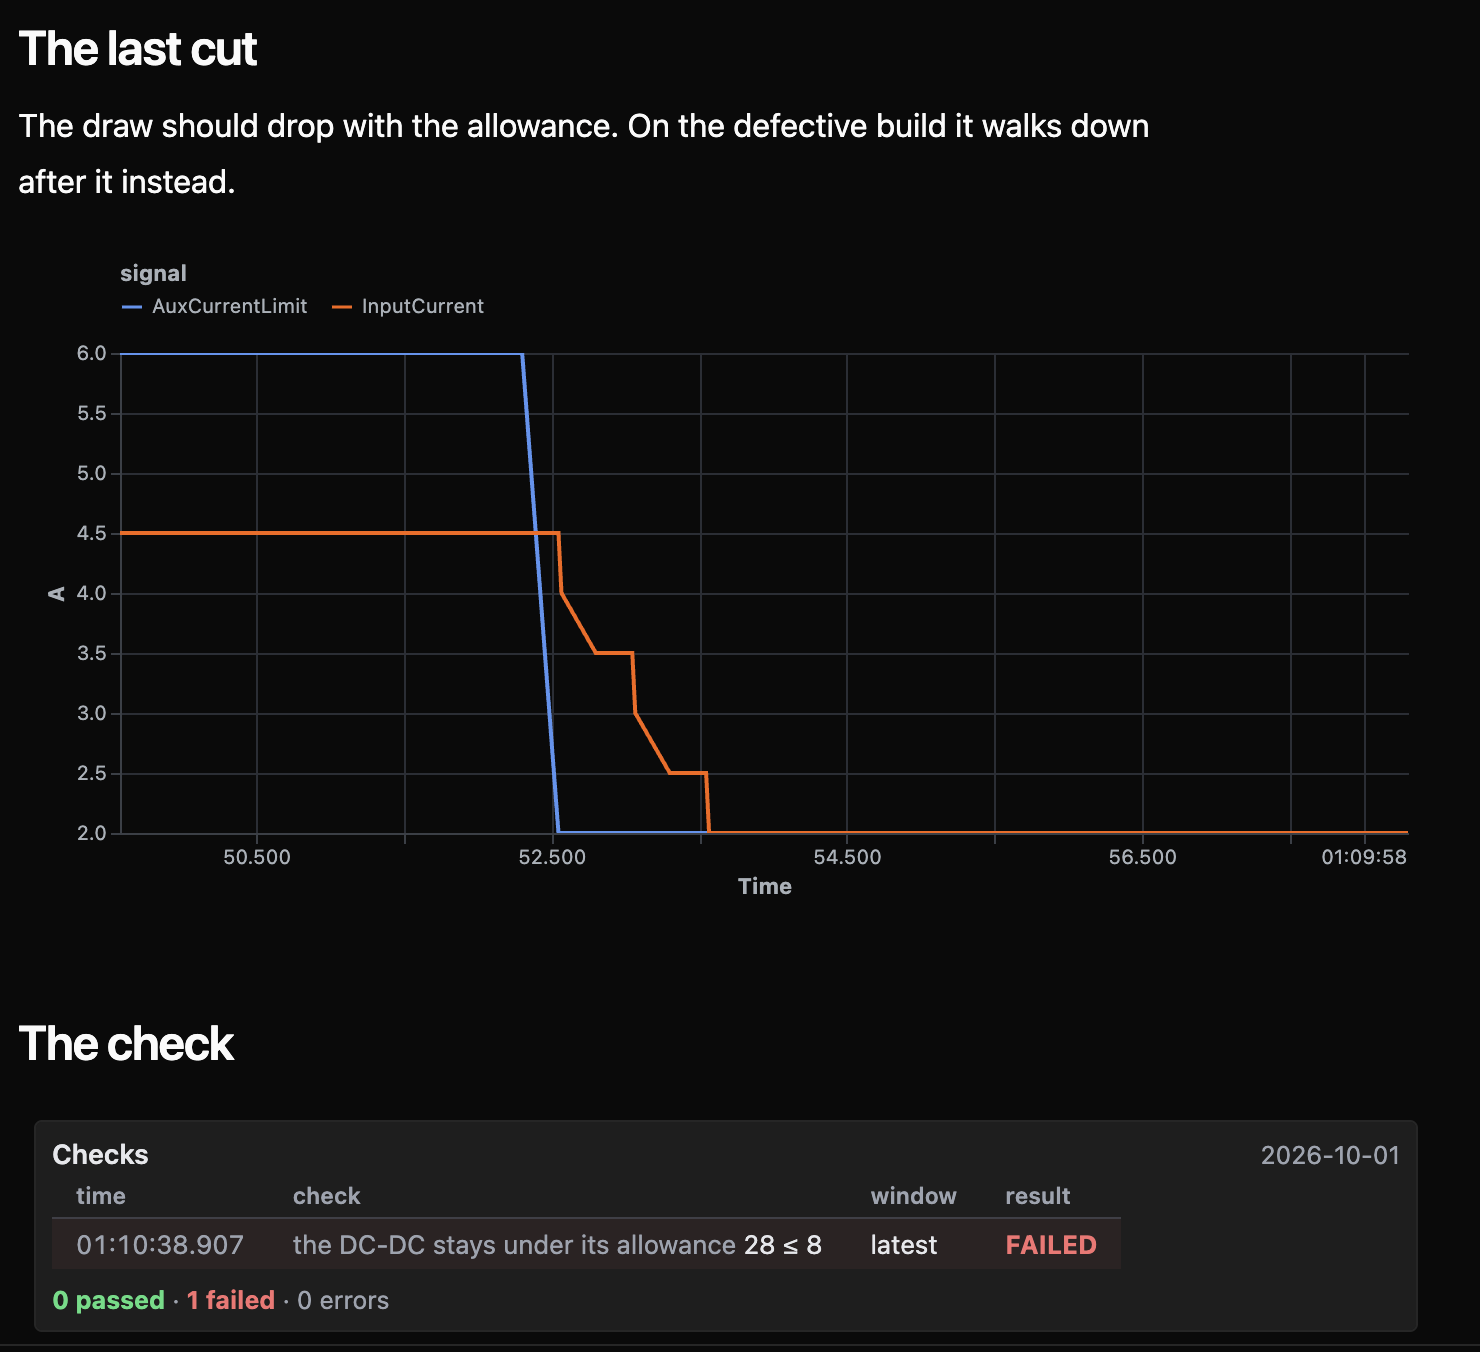
On the good build both notebooks pass. On the defective one, the allowance check goes red, and the chart above it plots the most recent cut. In CI, the same two notebooks run on the agent inside the bench's container whenever a push or pull request touches the bench, and the run keeps their reports, including from the runs that fail. CI runs the good build, so there they should stay green.
Pointing it at real hardware
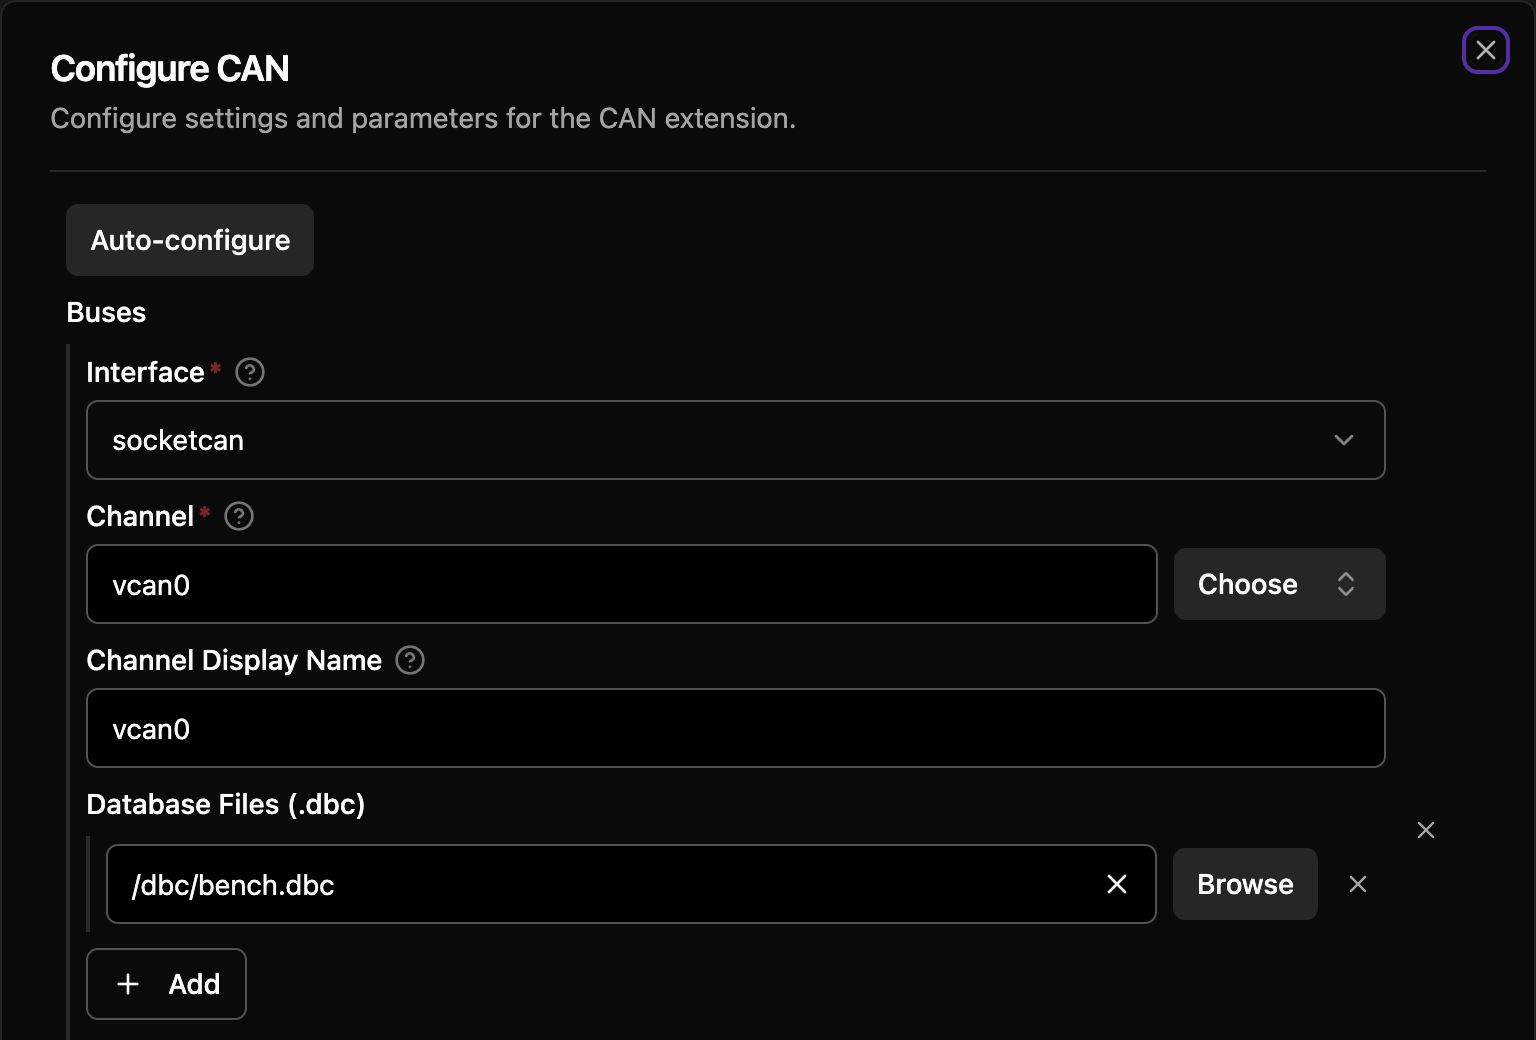
The workflows above don't depend on the emulator, but the bench's containers can't see a USB adapter on the host. On real hardware, run an agent on the machine the adapter is plugged into and install the CAN extension there. Its settings live on that agent, and you edit them from the app with the gear next to the extension in the Explorer: choose the interface and channel your adapter shows up as, and add your DBC. Plots and recordings work as they are; the notebooks need your signal names.
Try it
Everything is in zelos-examples/can-bench. Download the Zelos app, connect to the bench with New agent, and have a look around. Questions or ideas go to [email protected], or open an issue on the repo.