How-ToNotebooksMade with Zelos app 26.0.9
Write your first notebook and chart live signals
A notebook is a markdown file with Python cells. Make one, chart a battery pack's cell voltages from live data, and open the plain file it saves.

Contents10 sections
This guide makes a notebook, pulls two minutes of cell voltages from a battery pack, and charts them. It needs no hardware, because a simulated pack stands in for one.
This guide runs on simulated data. Install the CLI shows how to start it.
A notebook is a markdown file the agent runs
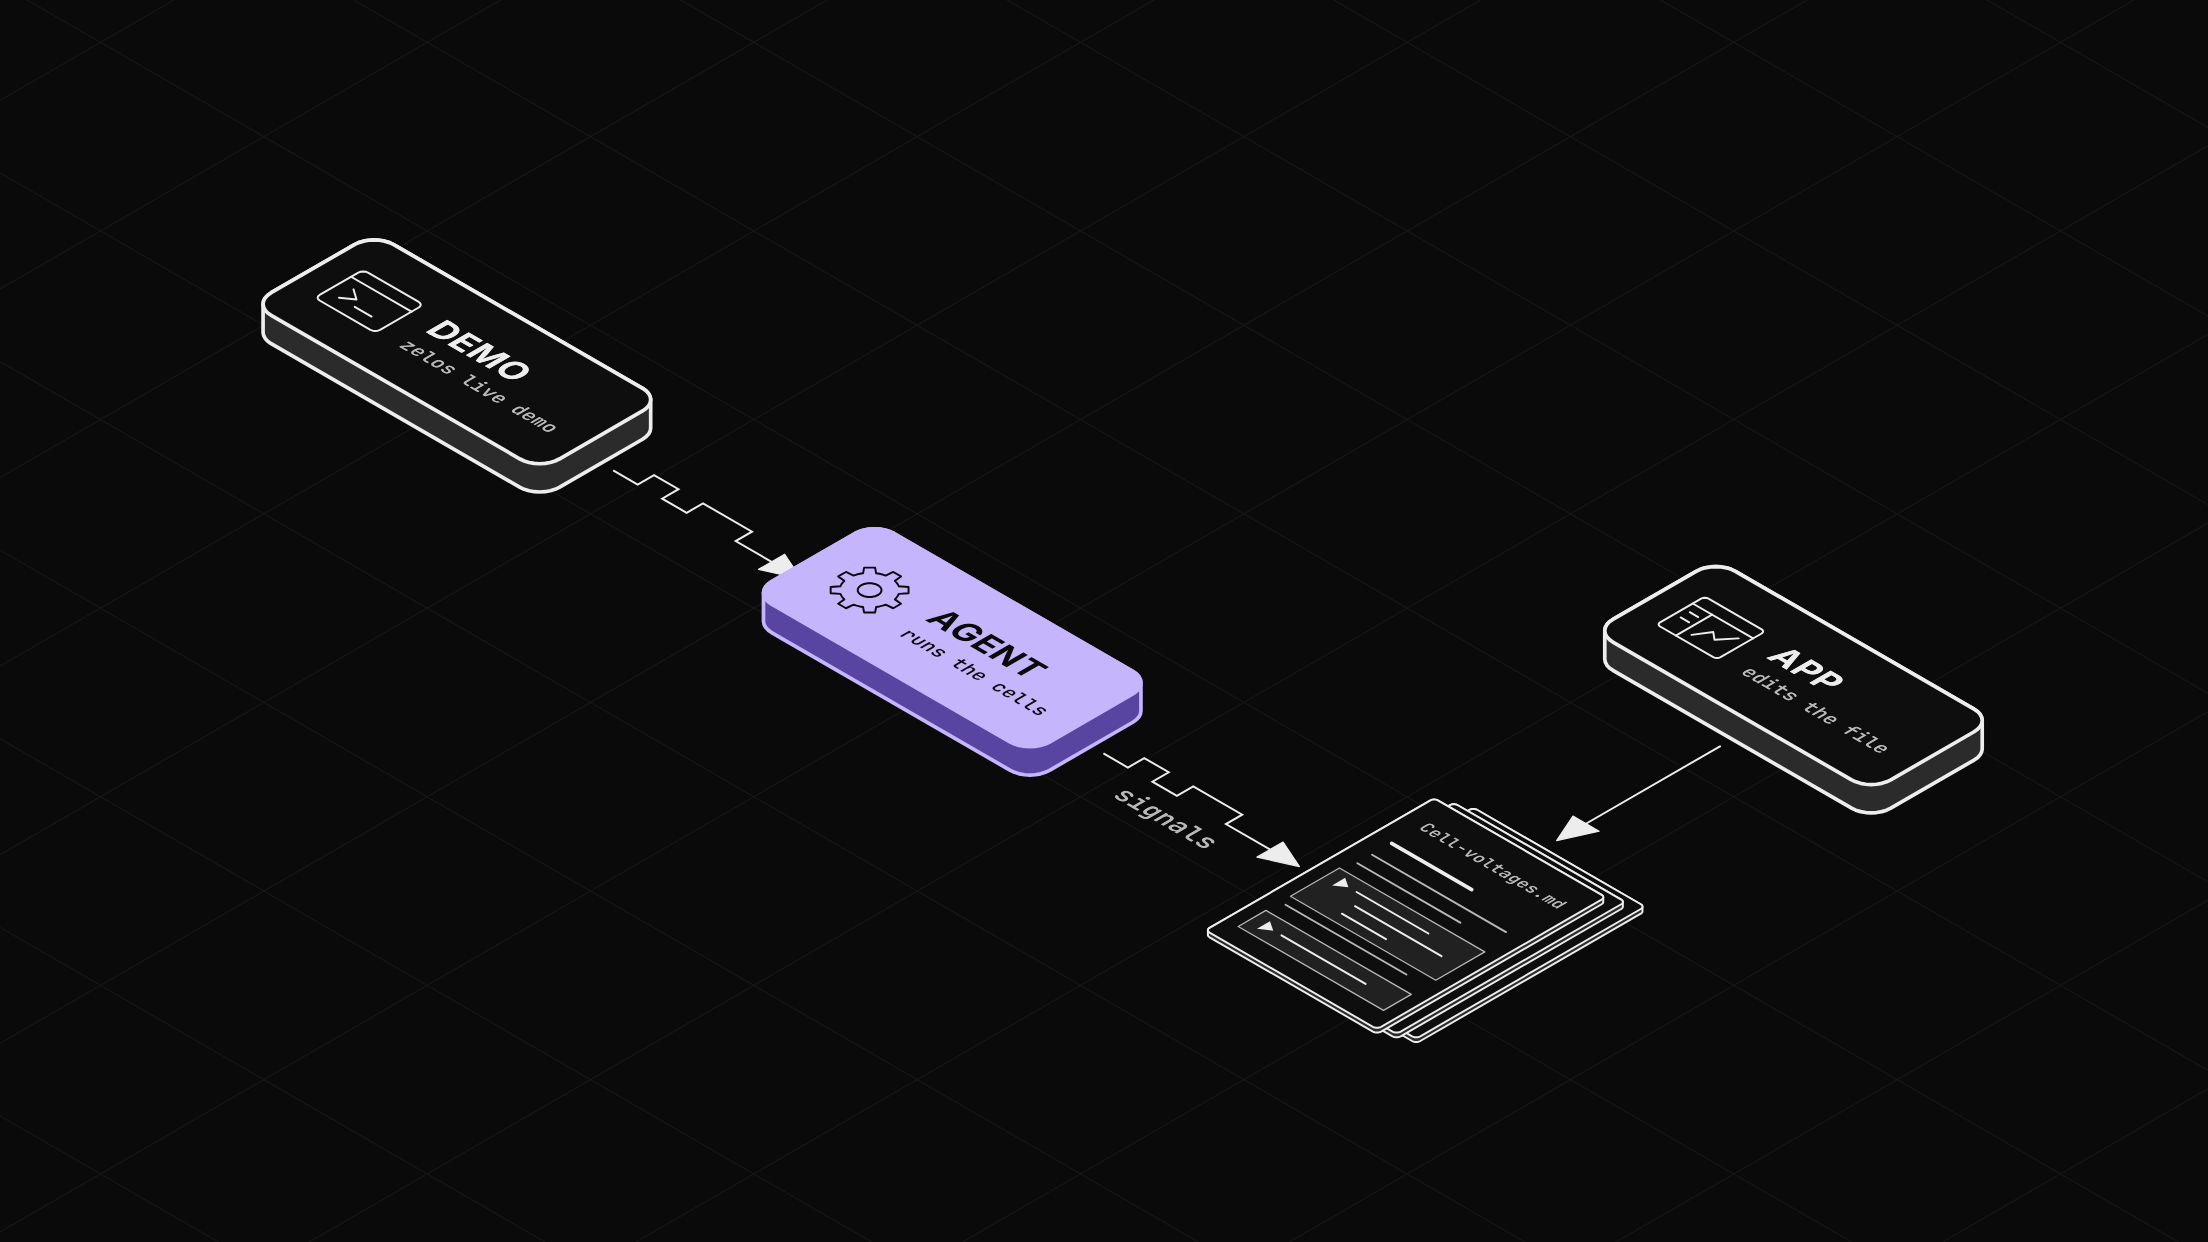
A notebook is one markdown file. Prose is ordinary markdown, and every python fence is a cell. The agent, the program that collects your signals, runs the cells in its own Python, and the cells ask that same agent for data. Results are stored beside the file, never in it, so the file stays small and diffs cleanly.
A notebook can be an analysis you run again on new data, a test that fails when a rule breaks, or a write-up for your team.
Before you start
- The Zelos app.
Step 1: Create a notebook
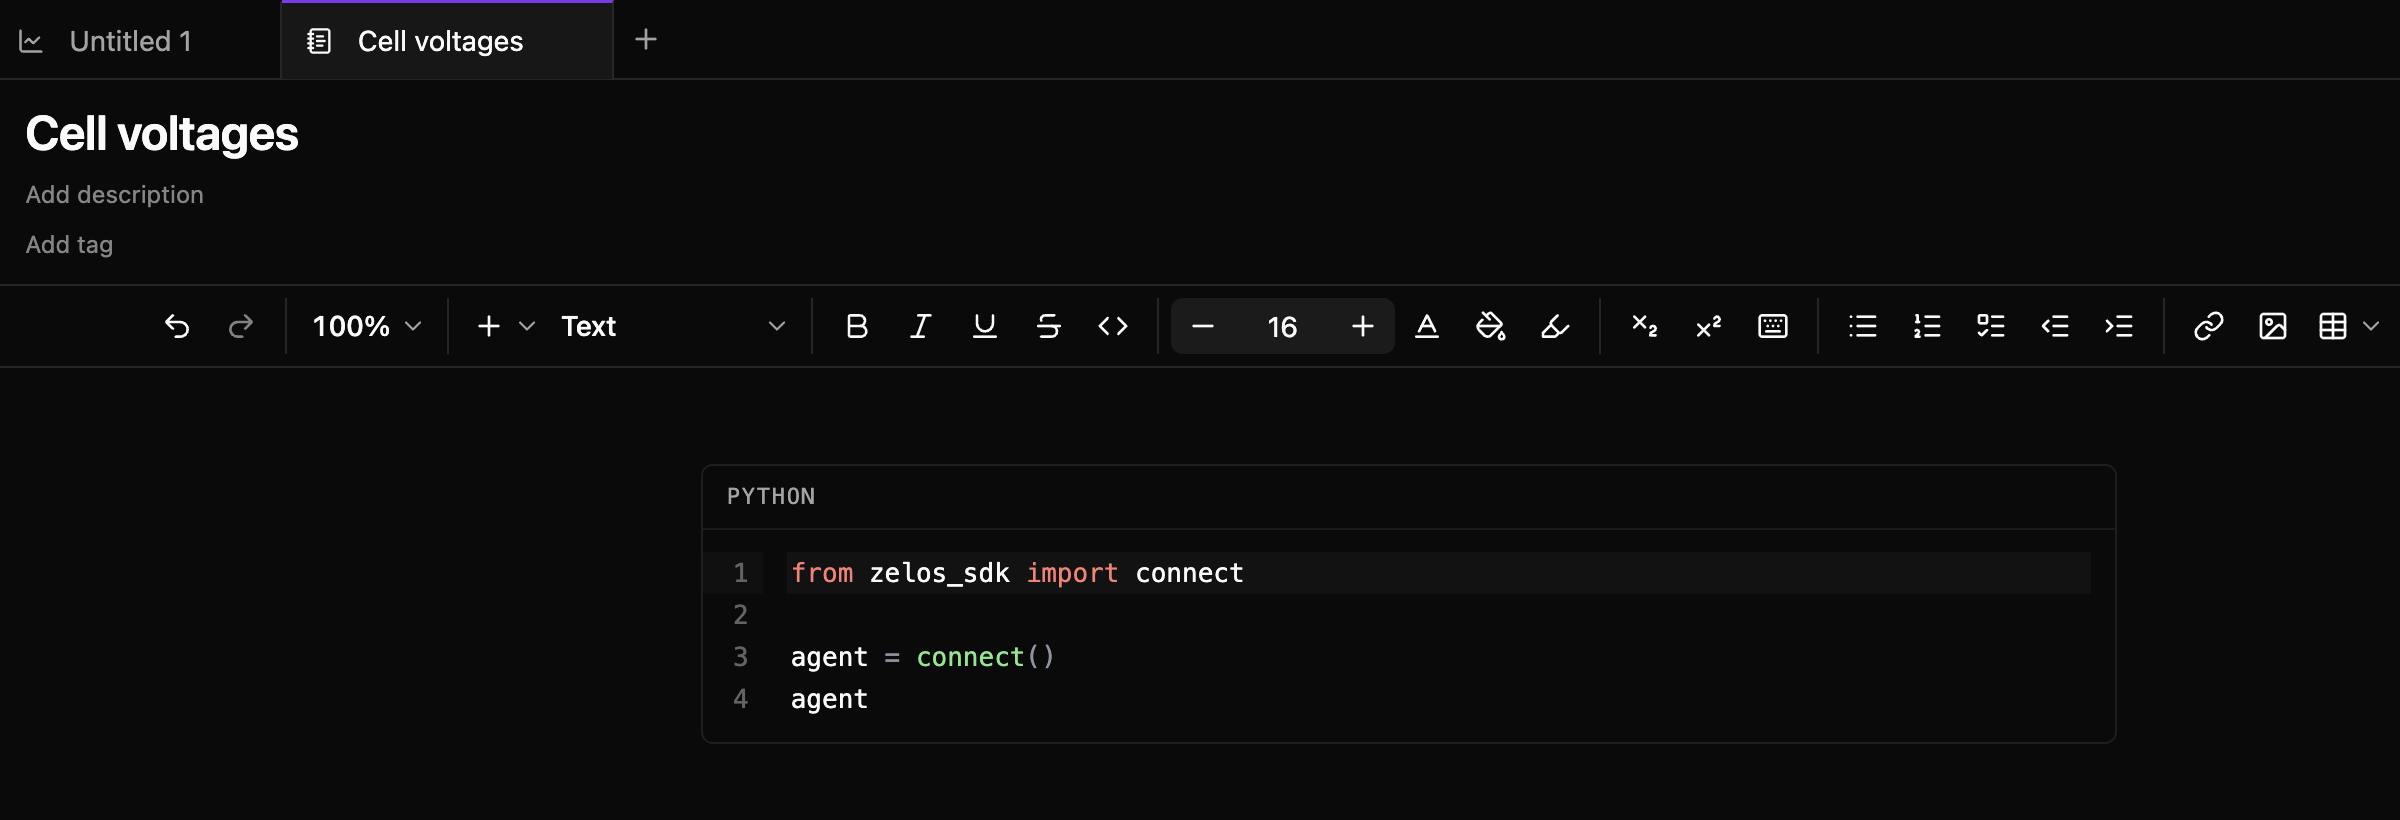
Select Notebooks in the left rail, then New notebook. It opens as a tab named Untitled, with one cell that connects to the agent, and the cursor waits in the name field. Type "Cell voltages" and press Enter. The name is the file name, so the file becomes Cell-voltages.md.
Step 2: Write the question in prose
Click below the starter cell and type the question in plain words:
Do all eight cells hold their voltage through a discharge cycle?
Step 3: Query the cell voltages
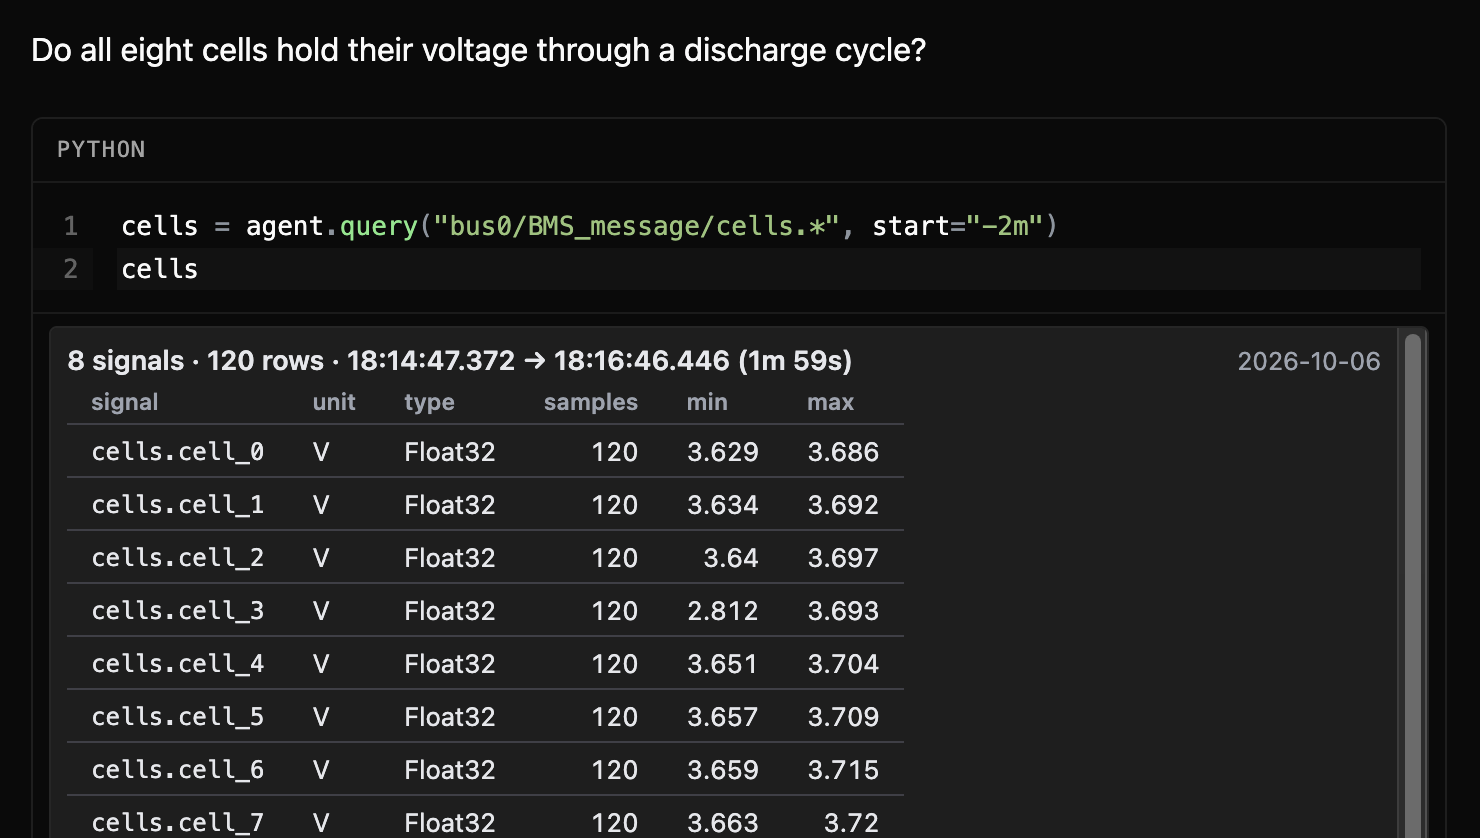
Type three backticks to start a Python cell. The path names the pack's cell-voltage message, and * takes every cell in it:
cells = agent.query("bus0/BMS_message/cells.*", start="-2m")
cells
A frame on a cell's last line renders as a summary: the time span it covers, then one row per signal with its unit, type, sample count, minimum and maximum. Look at the minimums.
Step 4: Chart them
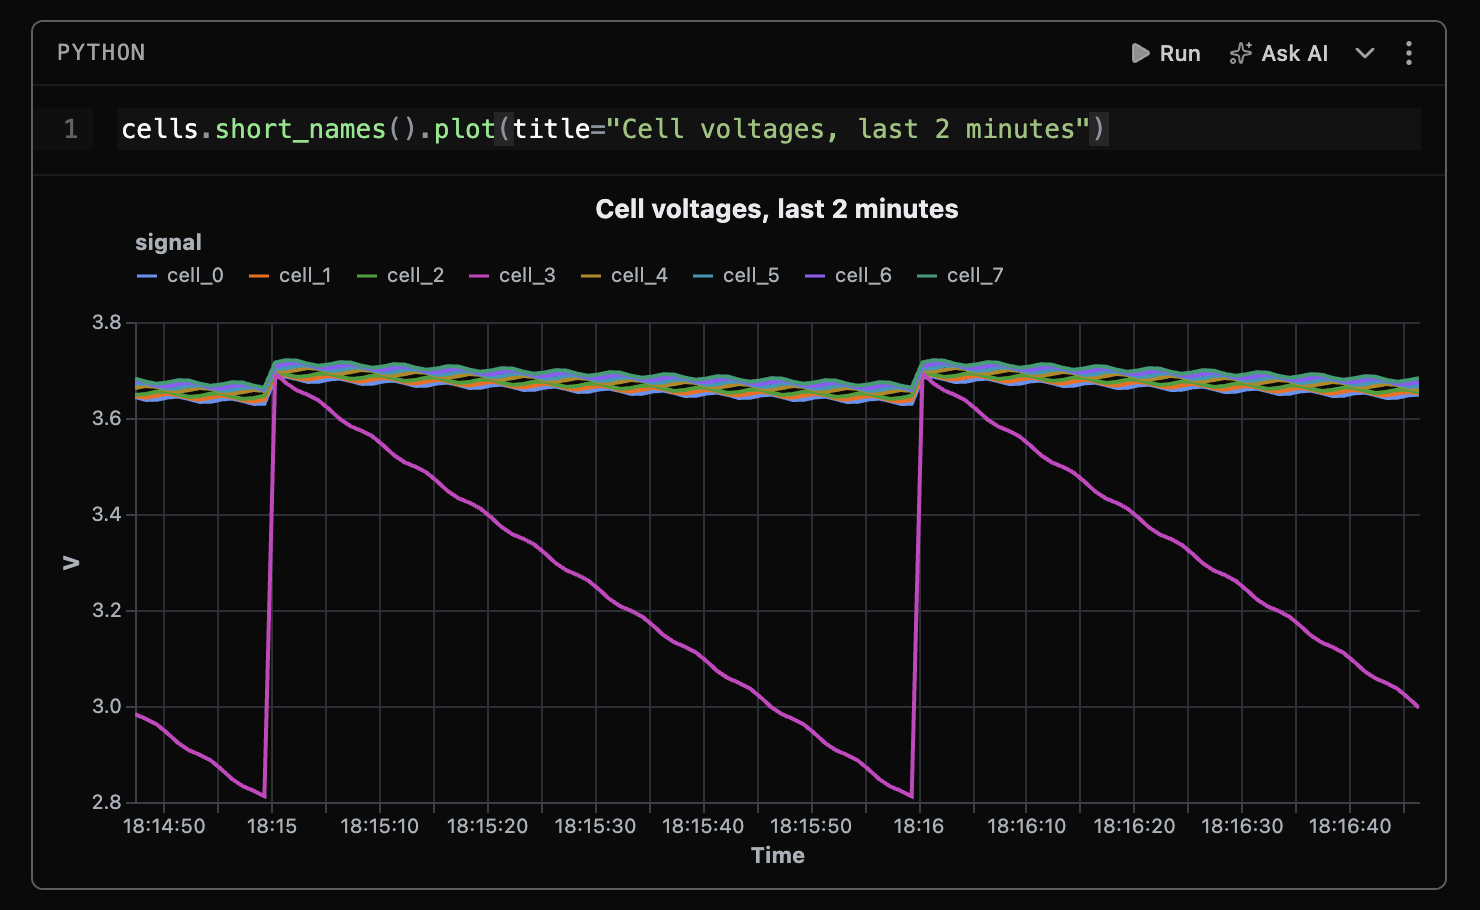
Add one more cell. short_names() labels each line cell_0 instead of the full path:
cells.short_names().plot(title="Cell voltages, last 2 minutes")Step 5: Run all
Choose Run all in the status bar. When the run ends, it reads "Up to date". Run a single cell with Cmd+Enter (Ctrl+Enter on Windows and Linux).
Now read the chart. In this example, seven cells sit near 3.7 V and sag a little over each one-minute cycle. The eighth, cell_3, dips under 3.0 V near the end of every minute.
Step 6: Open the file
In the Notebooks list, open the notebook's menu and choose Show in folder. The file is plain markdown: front matter, your sentence, and three python fences, each tagged with a short id. It holds no outputs, so a diff shows only what you changed.
---
authors:
- Maya Chen
requires-python: '>=3.10'
dependencies:
- zelos-sdk[notebook]
---

```python {#64568dc6}
from zelos_sdk import connect

agent = connect()
agent
```

Do all eight cells hold their voltage through a discharge cycle?

```python {#j8f6cd9a}
cells = agent.query("bus0/BMS_message/cells.*", start="-2m")
cells
```

```python {#zepnkggj}
cells.short_names().plot(title="Cell voltages, last 2 minutes")
```
Rename and move from the app
Outputs live beside the file, keyed to the cell ids, not in it. Rename or move a notebook from the app, so its outputs follow it.
Turn the dip into a test
Turn a notebook into a pass/fail test adds a rule that fails the run when a cell drops below 3.0 V. To run a notebook against a different time window, see Re-run a notebook on a new time window. The notebooks getting-started page covers the same ground as a reference.