How-ToExtensionsMade with Zelos app 26.0.9
Connect your hardware's protocol without writing code
Extensions connect the agent to your bench's interfaces. Install one from the marketplace, configure and start it, and plot its signals live.
Contents8 sections
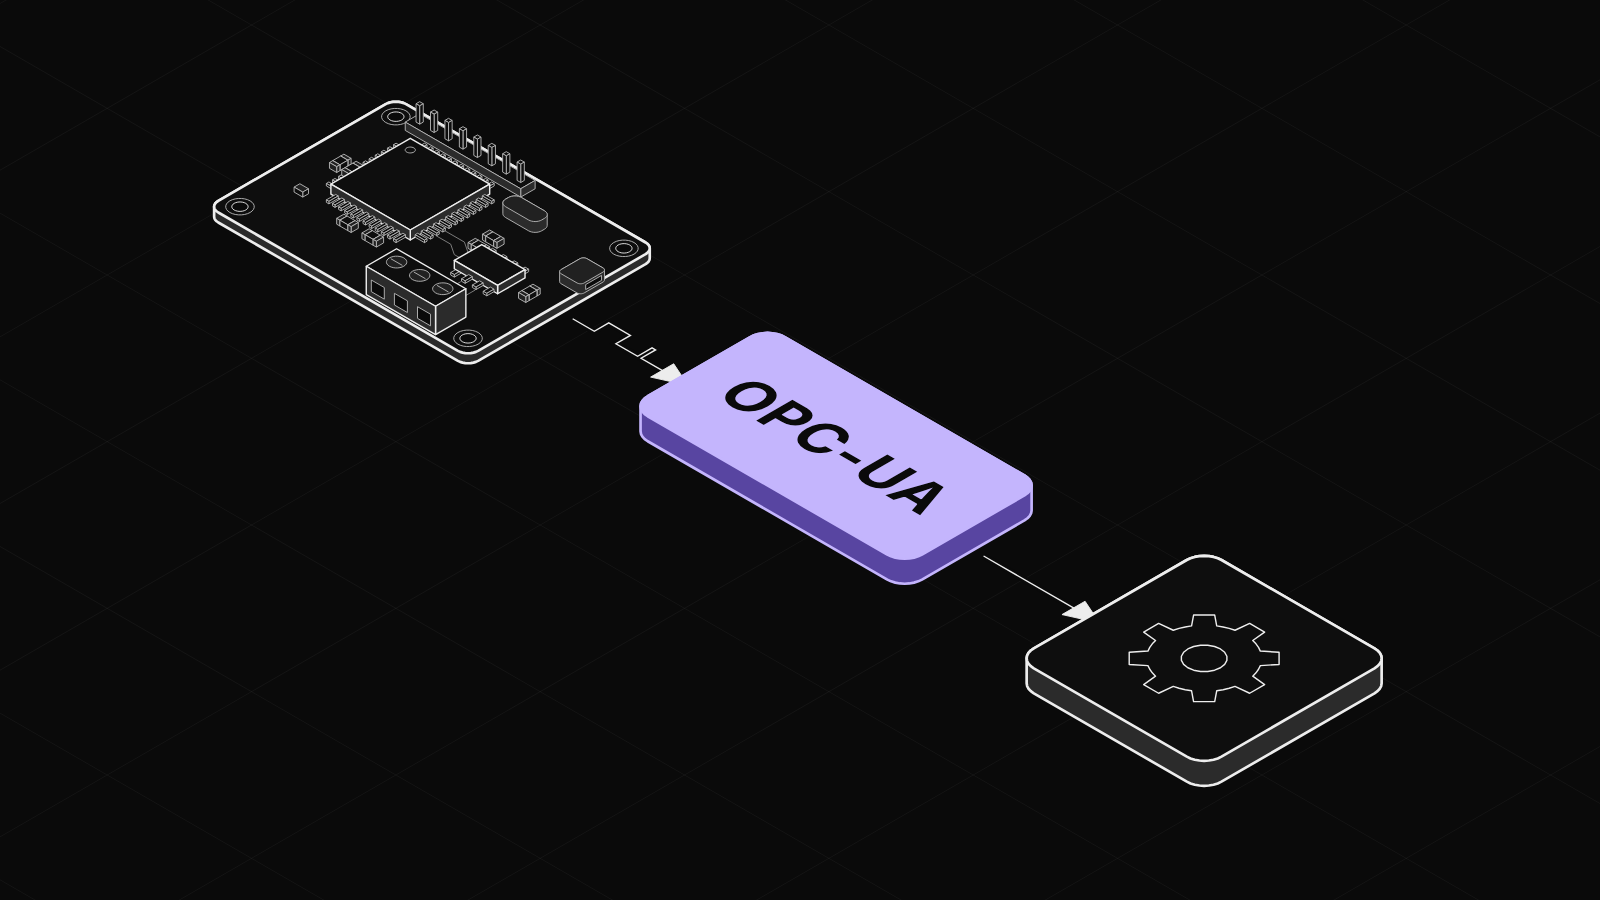
Your bench has its own interfaces, and you want all of them on one timeline. An extension connects the Zelos agent to one interface. You install, configure and start it from the app, without writing code.
An extension connects the agent to one interface
The agent is the program that collects data from your hardware and serves it to the app. The app bundles one on your machine, named localhost. The agent does not speak any protocol itself. It manages extensions: drivers that each talk to one interface and turn what they read into signals, plus actions you can call. An extension can be written in any language.
These are agent extensions. App extensions are a second kind, which add a tab of their own to the app: see Build your own tab with live readouts and an action button. For a device of your own, you build its extension: see Build an extension for your own instrument.
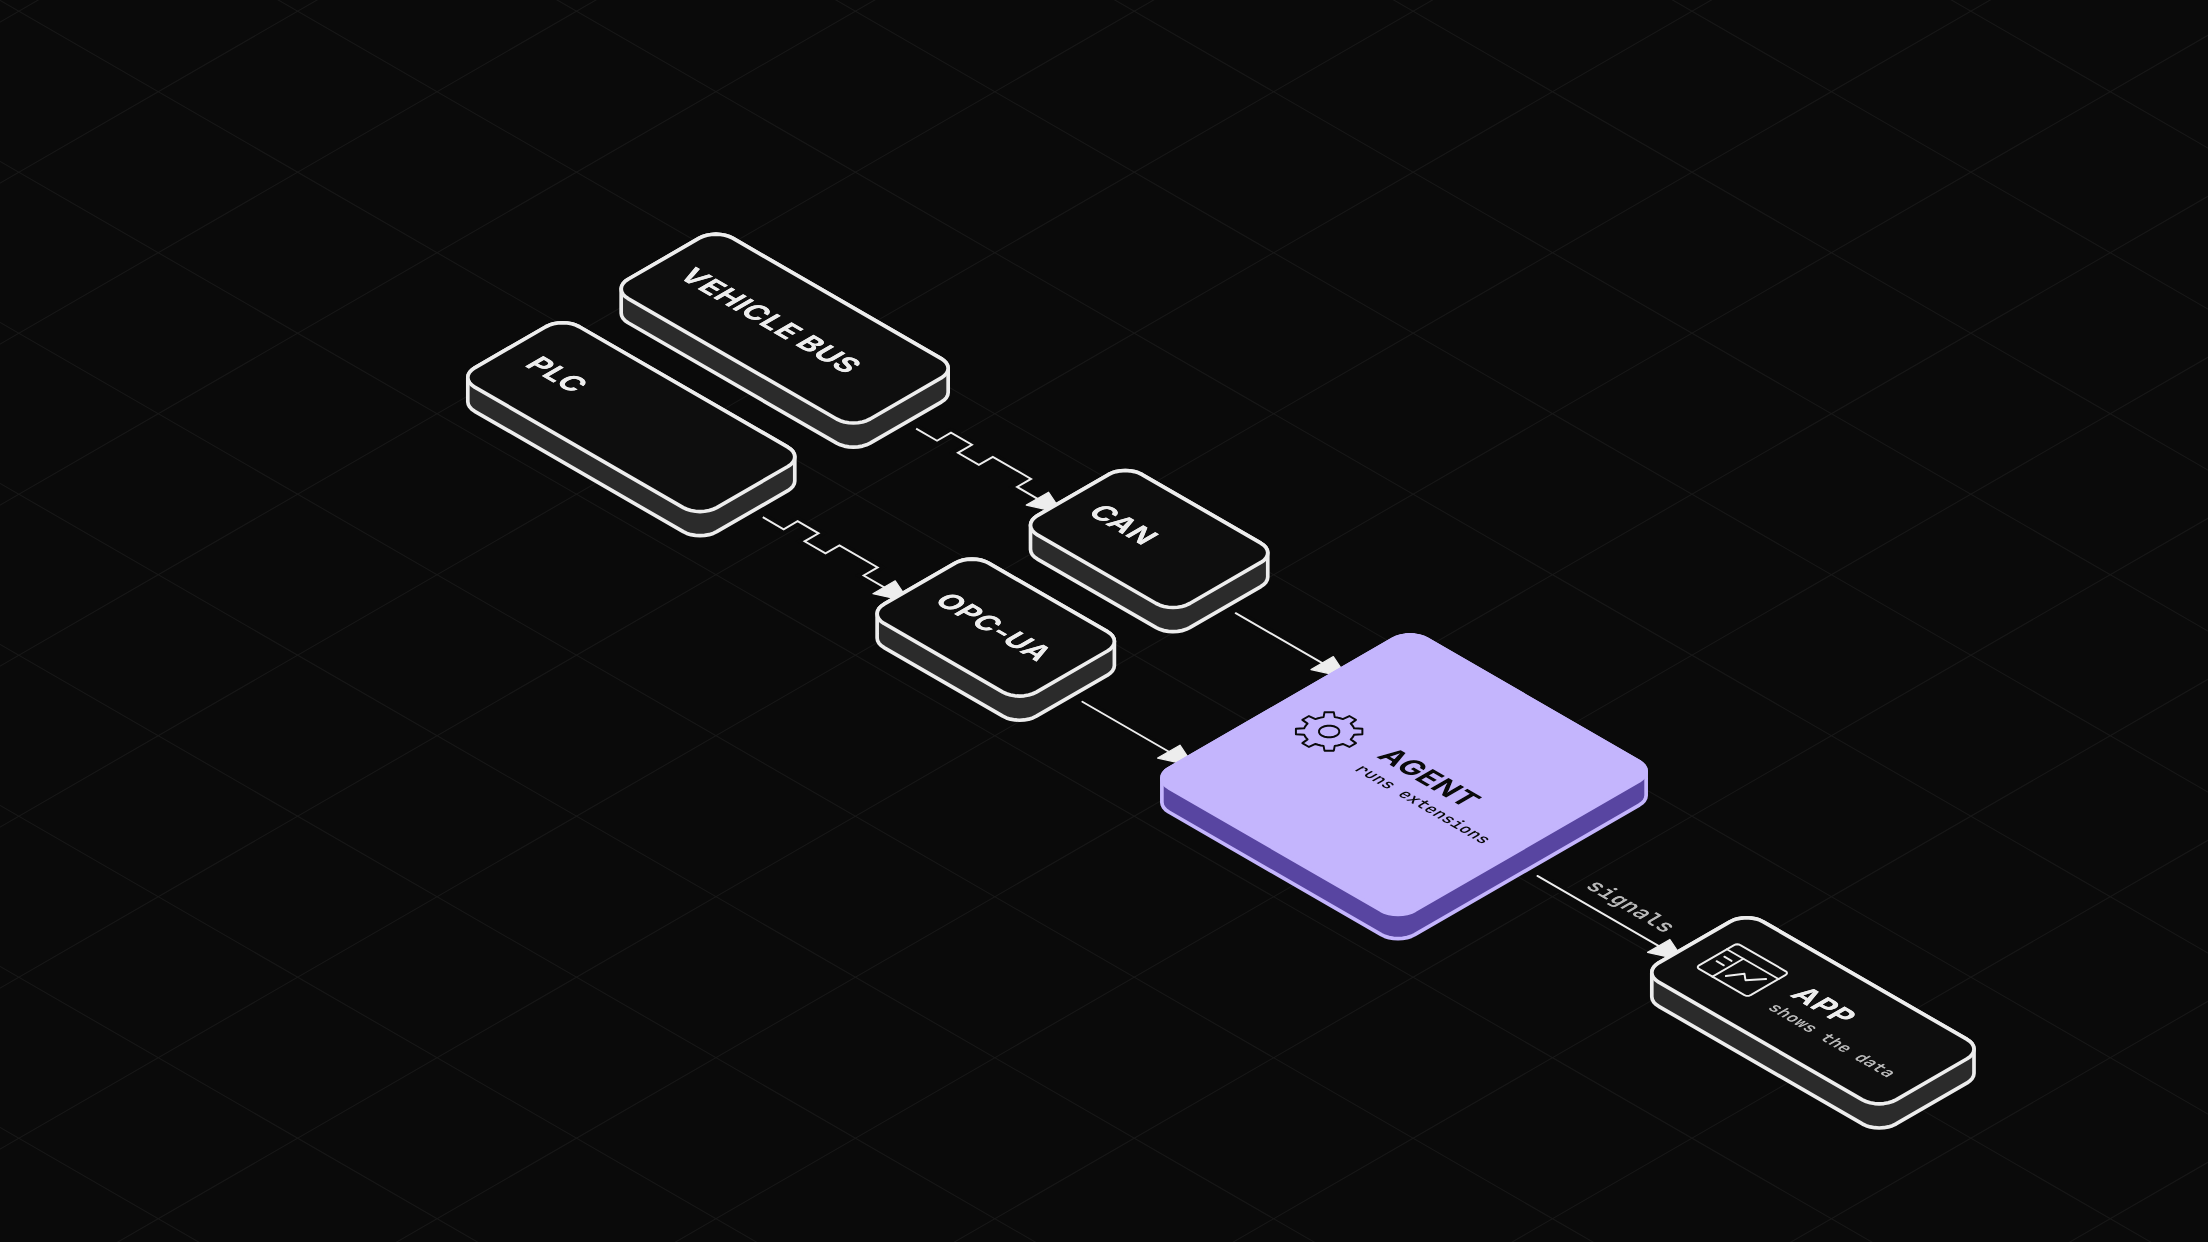
Every extension installs, configures and starts the same way. The steps below use OPC-UA as the example, because its Demo Mode runs a simulated PLC and needs no hardware.
Before you start
- The Zelos app.
Step 1: Find the extension
Select Extensions in the left rail. The MARKETPLACE section lists every published extension, agent and app extensions together.
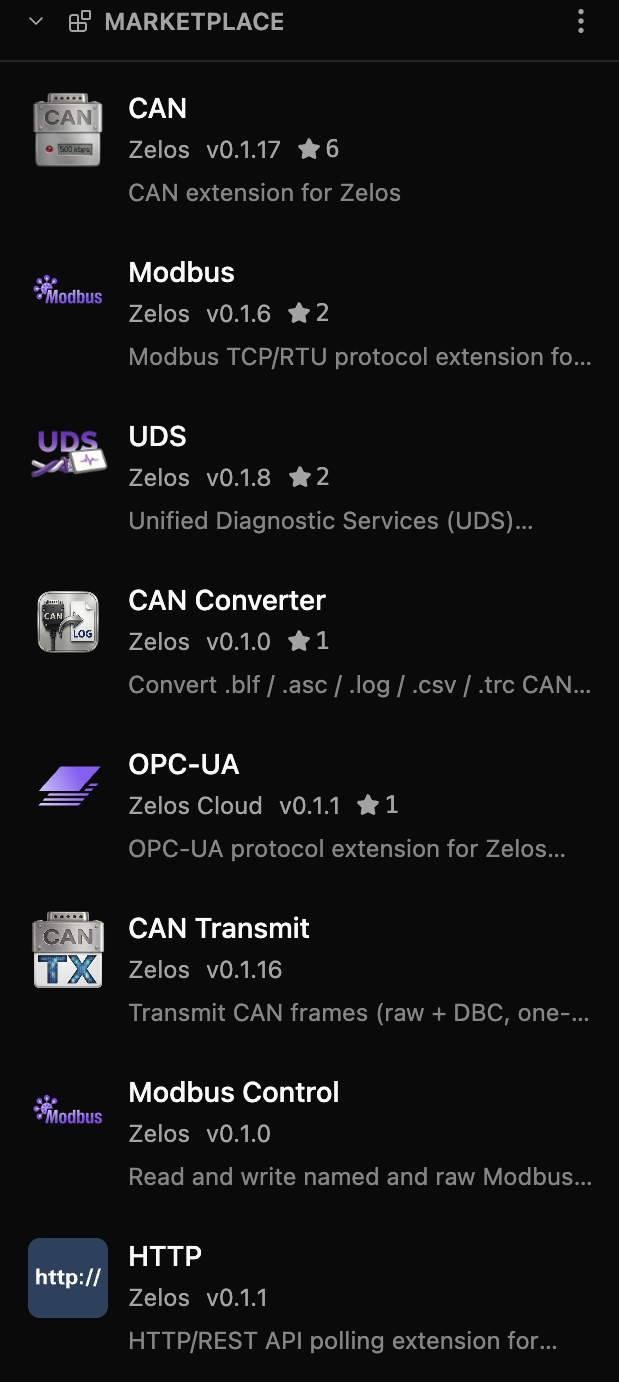
Click the search icon at the left of the rail and type "opc". The list narrows to OPC-UA. Click it to open the extension's page in a tab.
Step 2: Install it
Choose Install at the top right of the page. The app needs a connected agent and an internet connection. The button reads "Installing..." while the agent downloads and installs the extension. A toast then reads "OPC-UA installed", and the button turns into Uninstall.
Step 3: Configure and start it from Explorer
The extension's page has no Start button. Settings and Start live in Explorer, the first view in the rail, at the bottom of its EXTENSIONS section. Click the gear on the OPC-UA row to open Configure OPC-UA.
Each extension asks for its own settings, such as a server endpoint for OPC-UA or an adapter and bitrate for CAN. In this example, choose Auto-configure to look for OPC UA servers on this machine. None is running, so tick Demo Mode instead, then choose Save & Start. The dialog closes, and the play icon on the OPC-UA row turns into a red square while the extension runs.
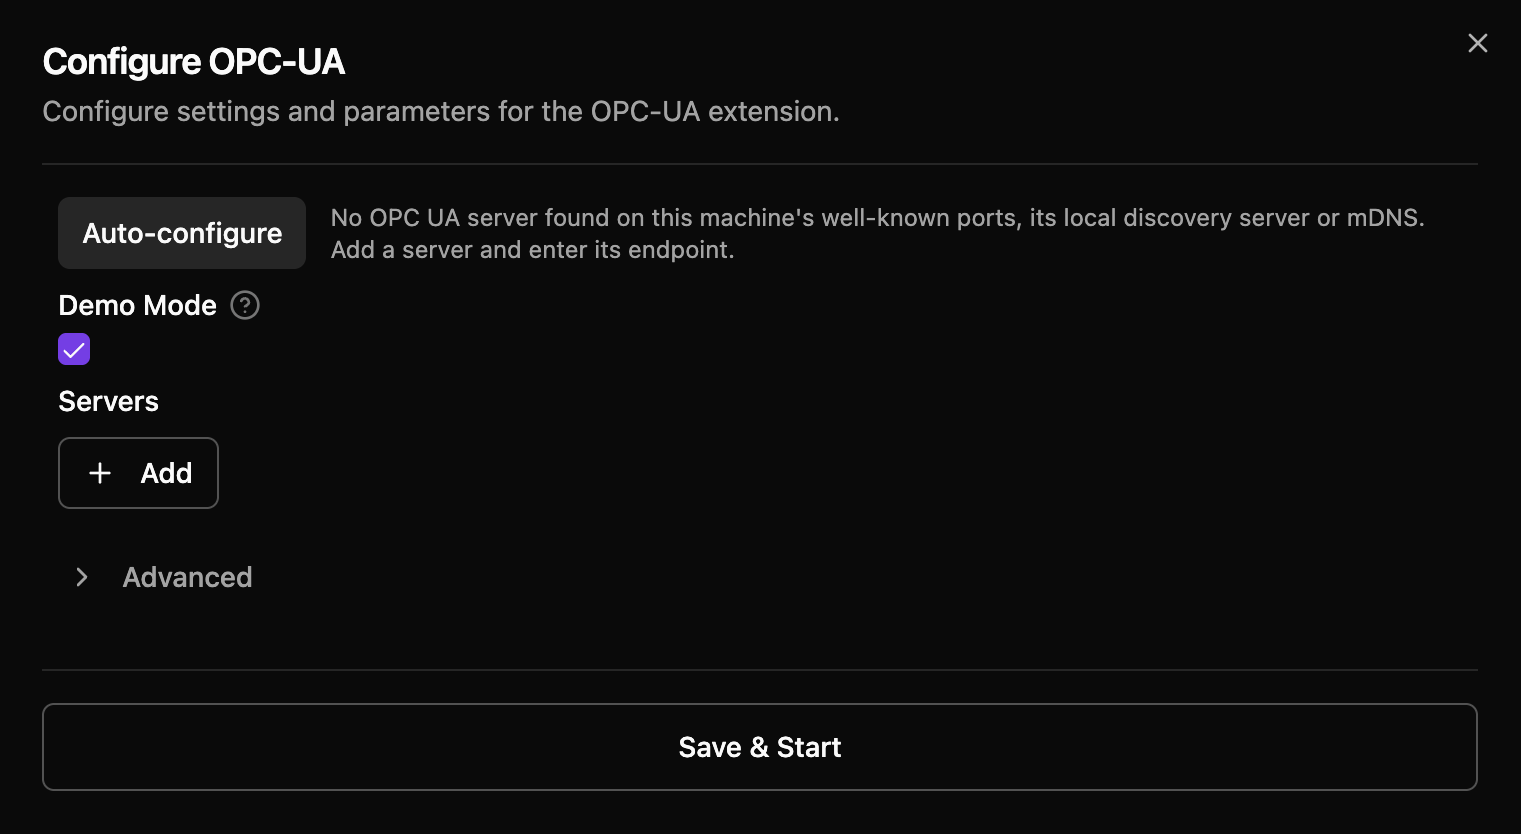
With a real server, Auto-configure fills in each server it finds, or you choose Add under Servers and enter its endpoint.
Step 4: Plot a signal
The extension's signals appear in Explorer's SIGNALS section, under OPC-UA, then demo. The simulated PLC publishes temperature, pressure, motor and more. Switch back to the workspace tab, open temperature, and drag temp_sensor1 into the workspace. A plot draws it live. Drag the plot's bottom-right corner to make it taller.
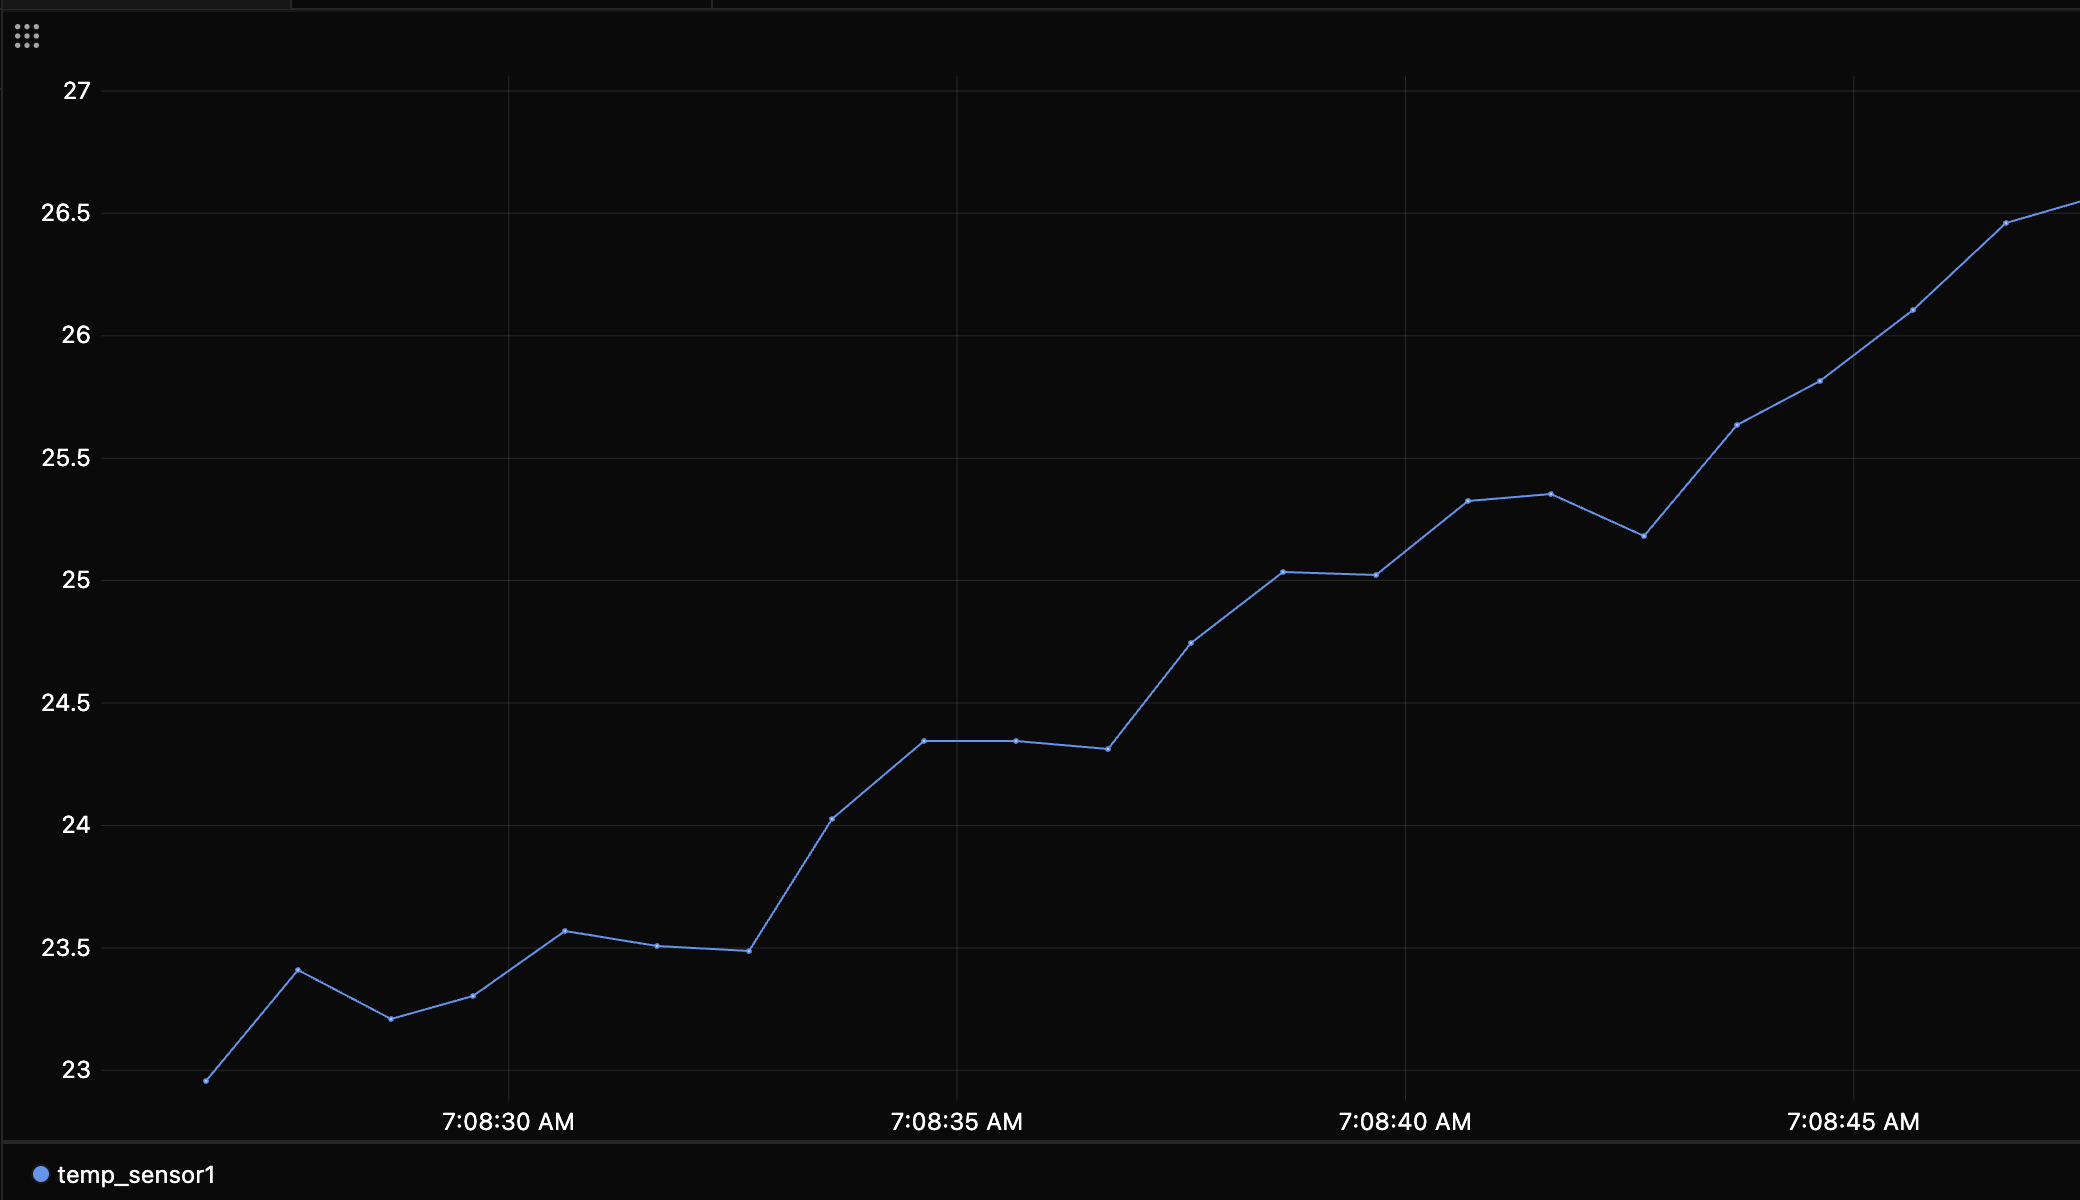
To pick a different panel for a signal, see Pick the right panel for each signal.
Where people get stuck
- Looking for Start on the extension's page. Start is on the extension's row in Explorer.
- Several agents connected. Install is off until only one agent is connected, so the app knows where to install.
Install the extension for your bench
Open Extensions, search for your interface, and install it the same way. The Extensions docs page covers updates and logs. The CLI can also install one with zelos extensions install <name>, for example zeloscloud/zelos-extension-opcua. Next, read Keep extensions running, and find out why one stopped for logs, crashes and updates.