Start here
Find your way around the app
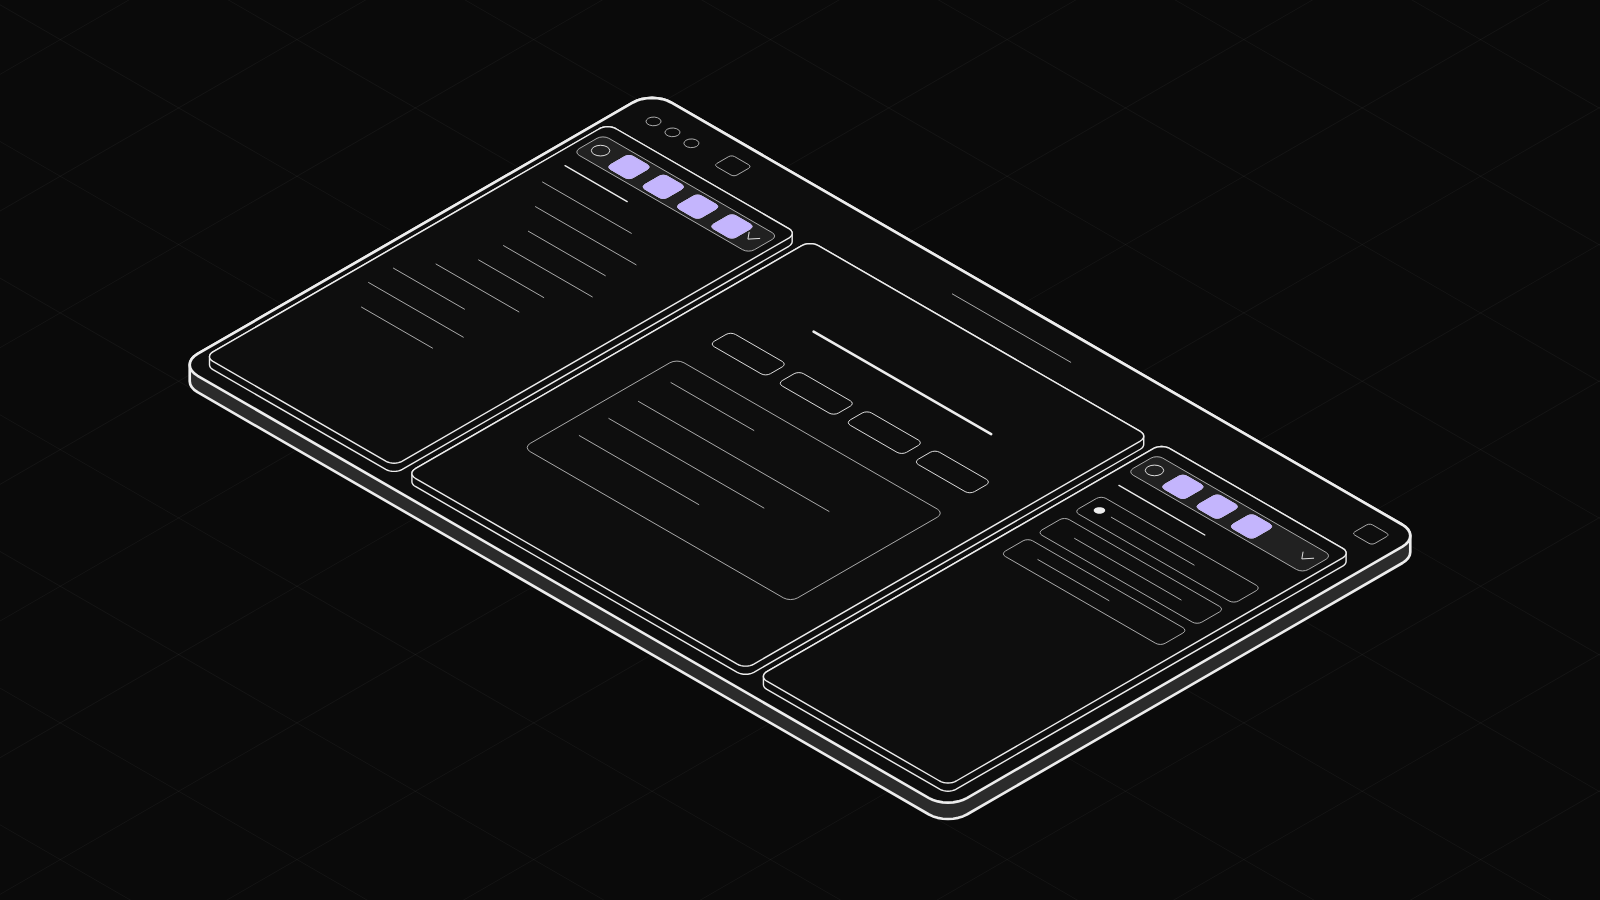
A tour of the desktop app in the order you meet it: Home, data sources, Explorer, tabs and panels, the timeline, traces, layouts, and the sidebar views.
Read the guideStart here
A tour of the desktop app in the order you meet it: Home, data sources, Explorer, tabs and panels, the timeline, traces, layouts, and the sidebar views.
Read the guide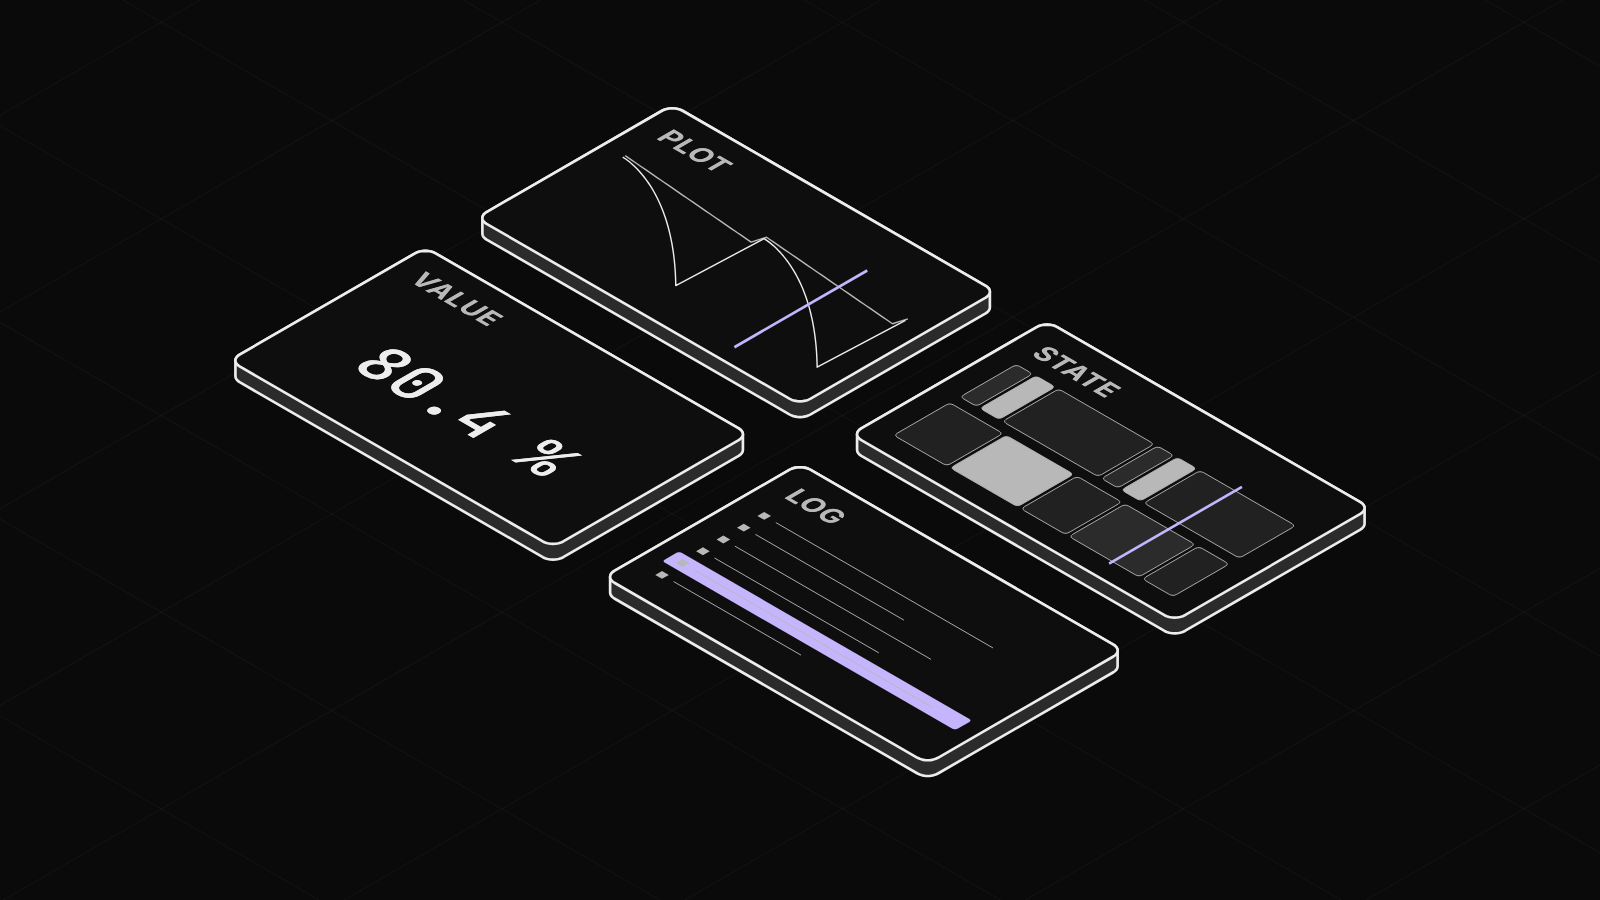
Choose a panel by the shape of the signal: a plot for a value that moves, state bands for a value that holds, a large readout, or a log.
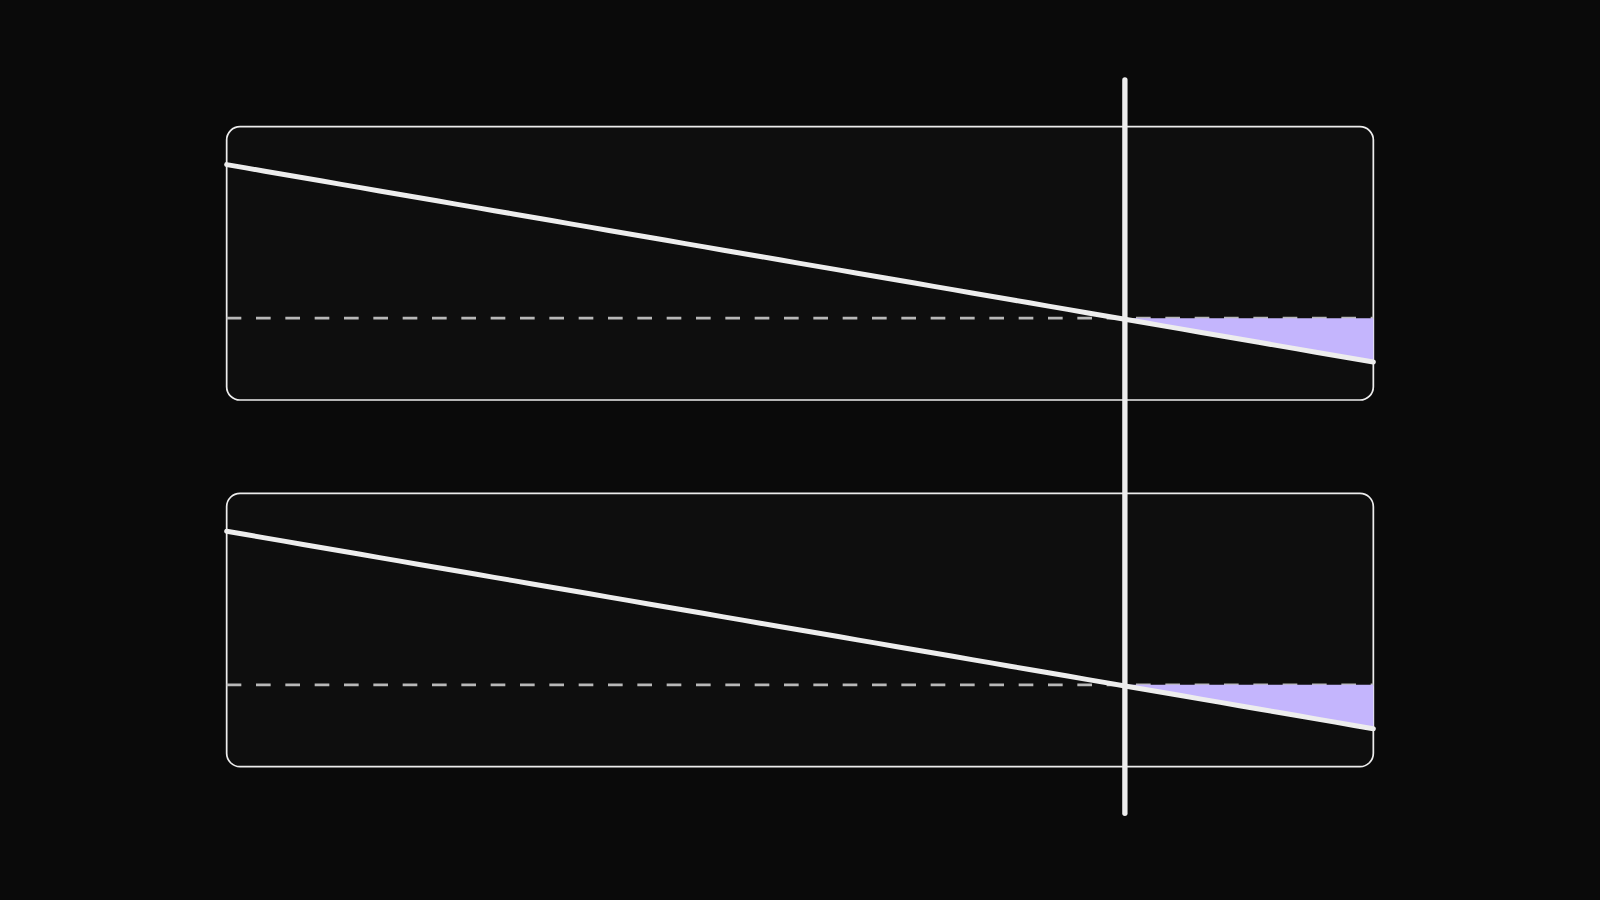
Freeze a live view on one moment, read every panel there, measure a change, then save the run and lay it over an earlier one.
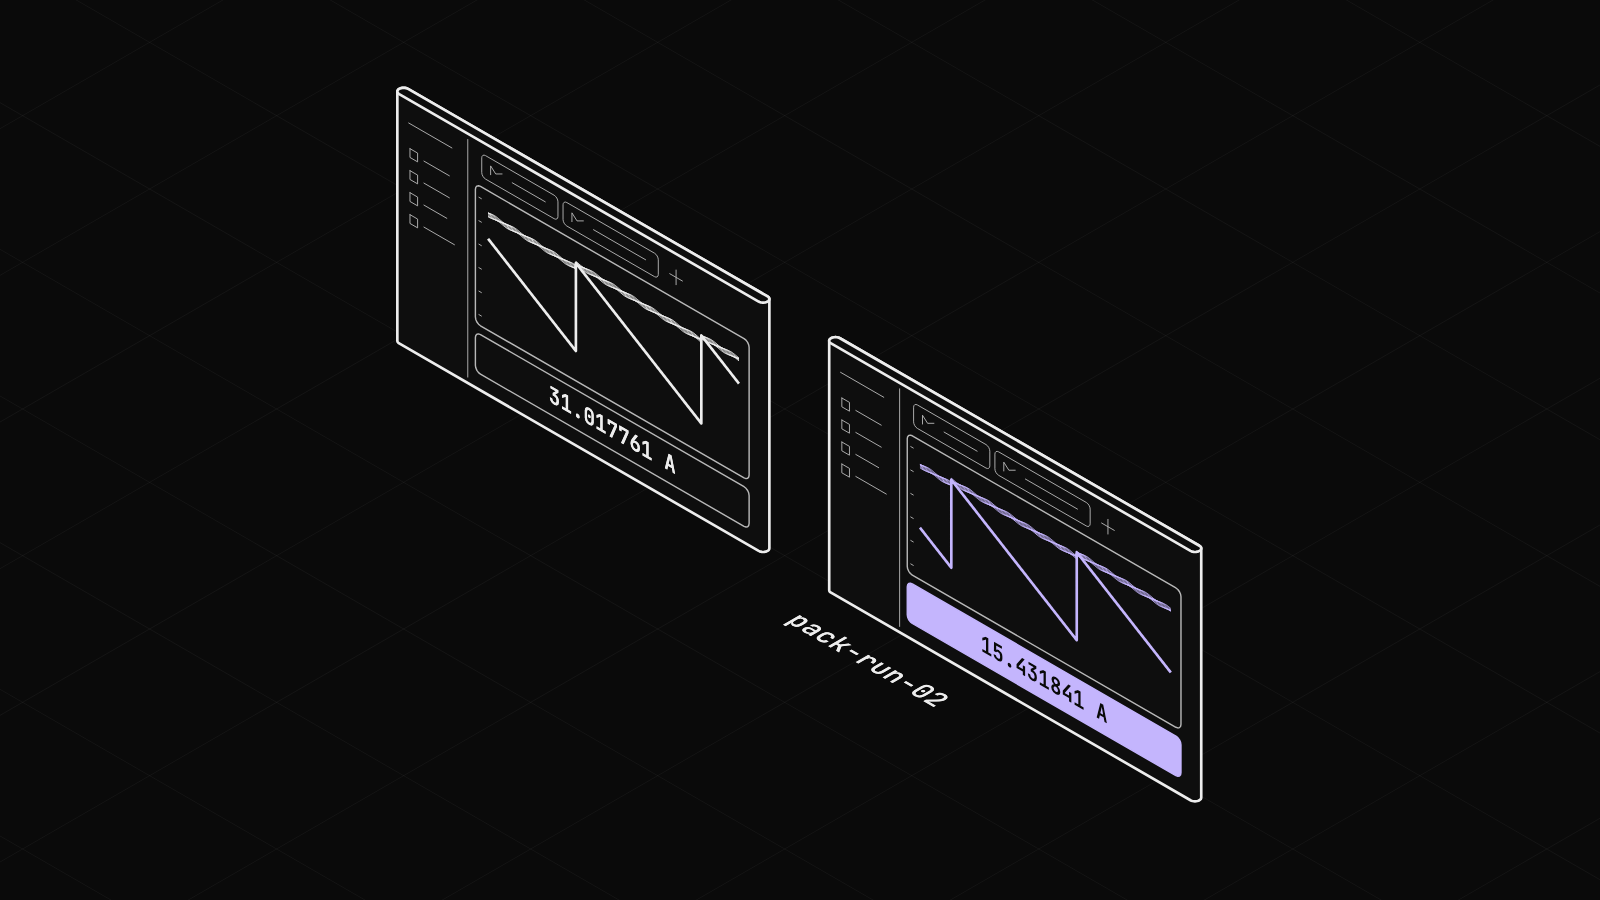
Save your panels and tabs as a layout, then load it on any recorded trace to get the same view in one click.
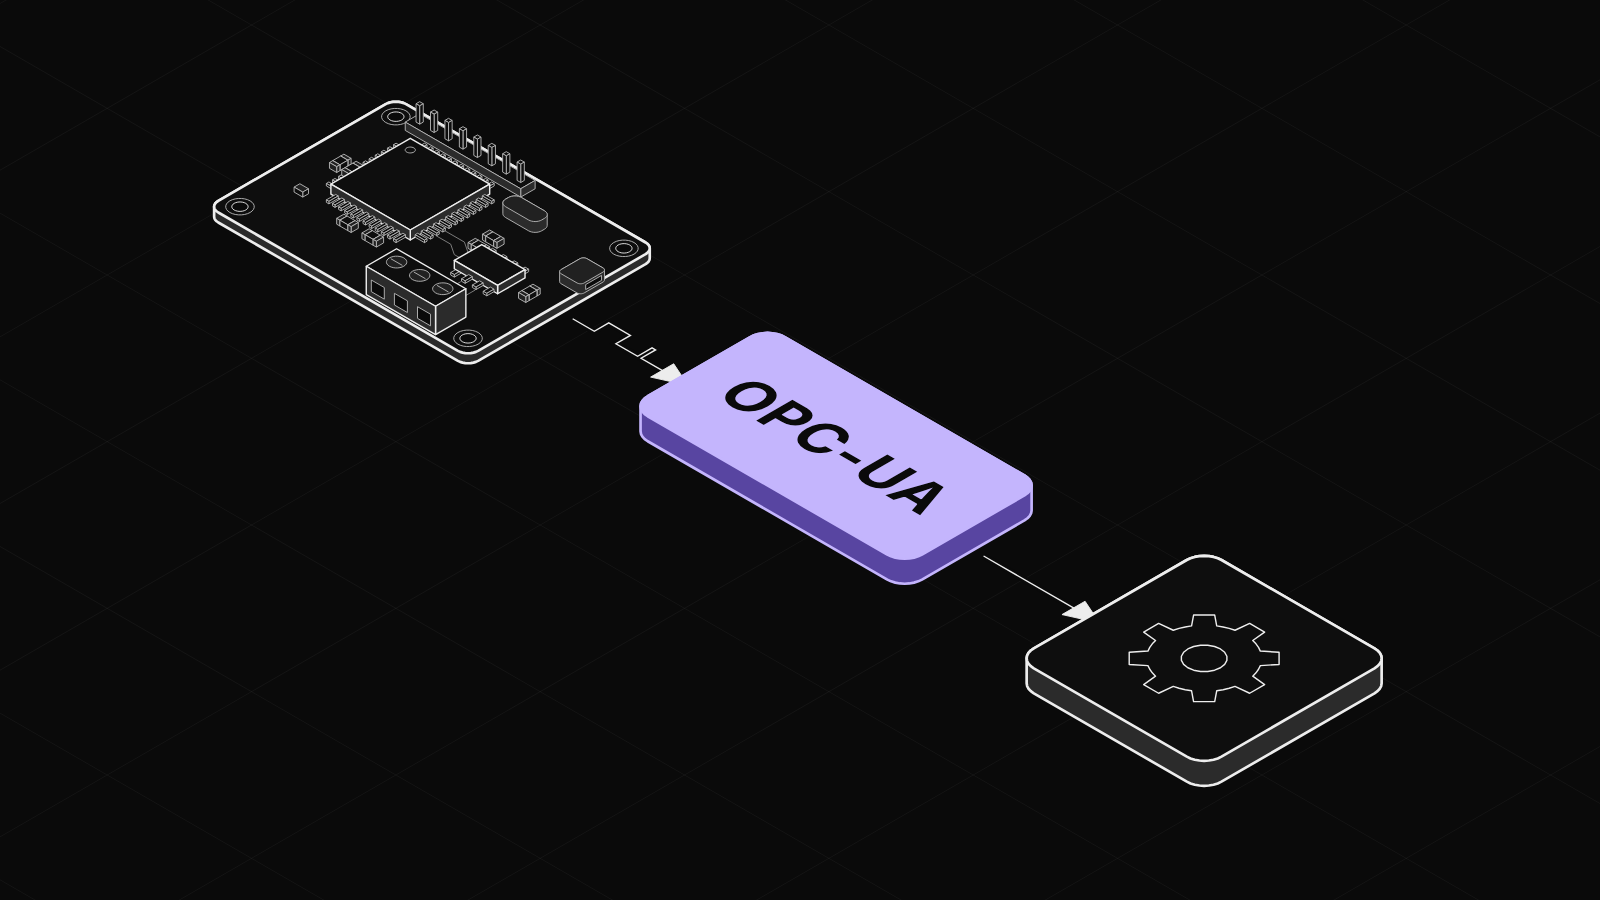
Extensions connect the agent to your bench's interfaces. Install one from the marketplace, configure and start it, and plot its signals live.
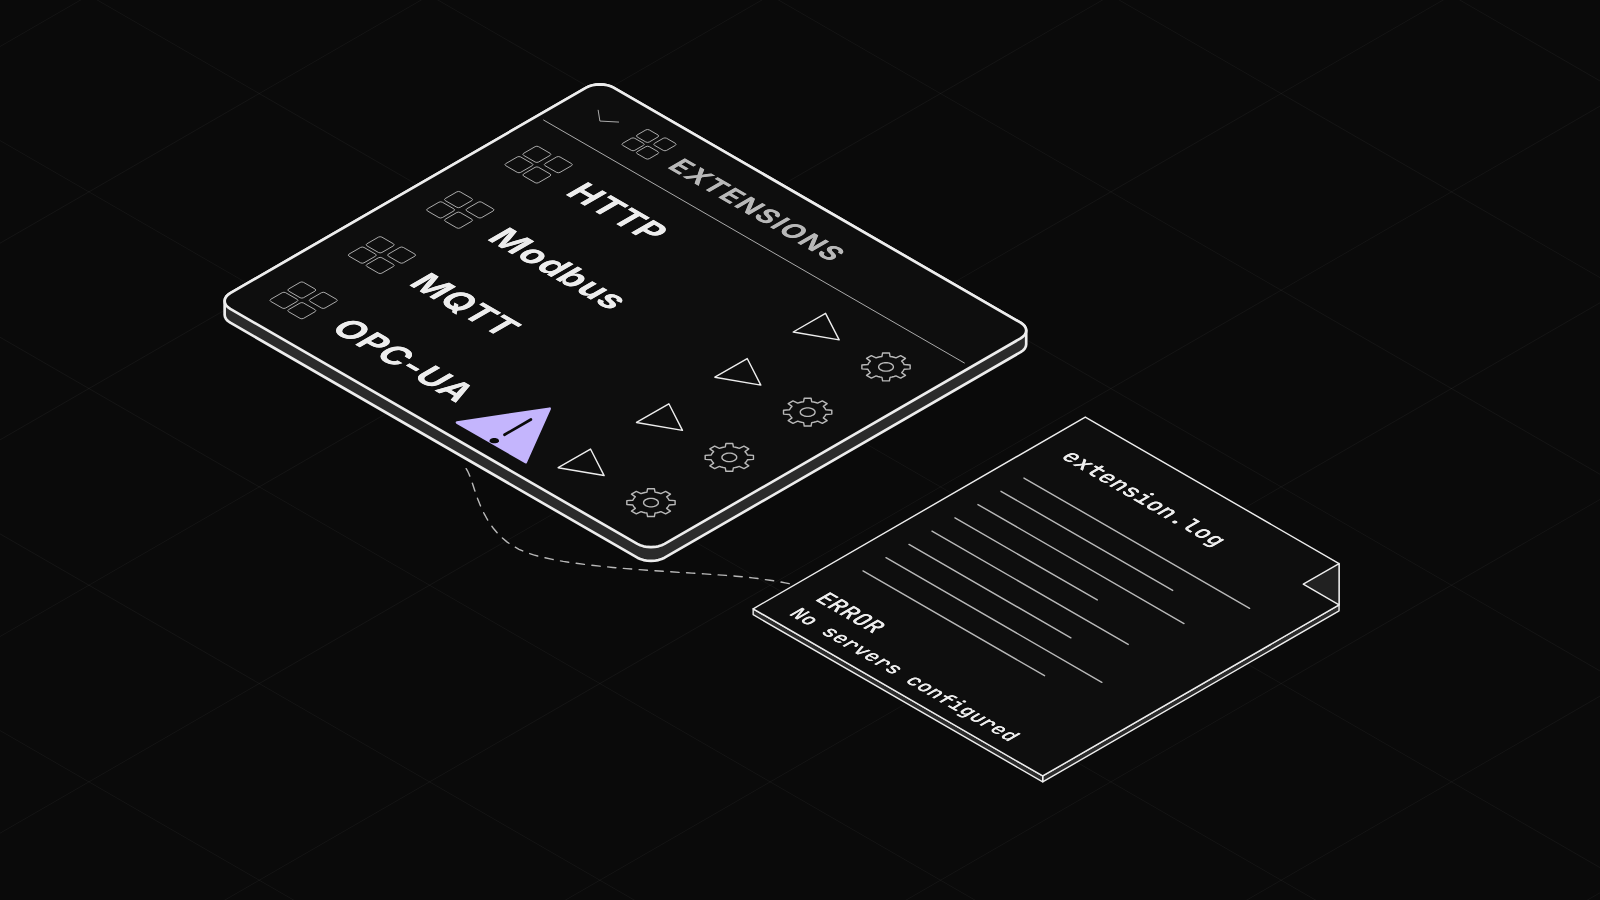
Read the extension icons, trace a stopped extension to one line in its log, fix the setting and restart it, and update or remove extensions.
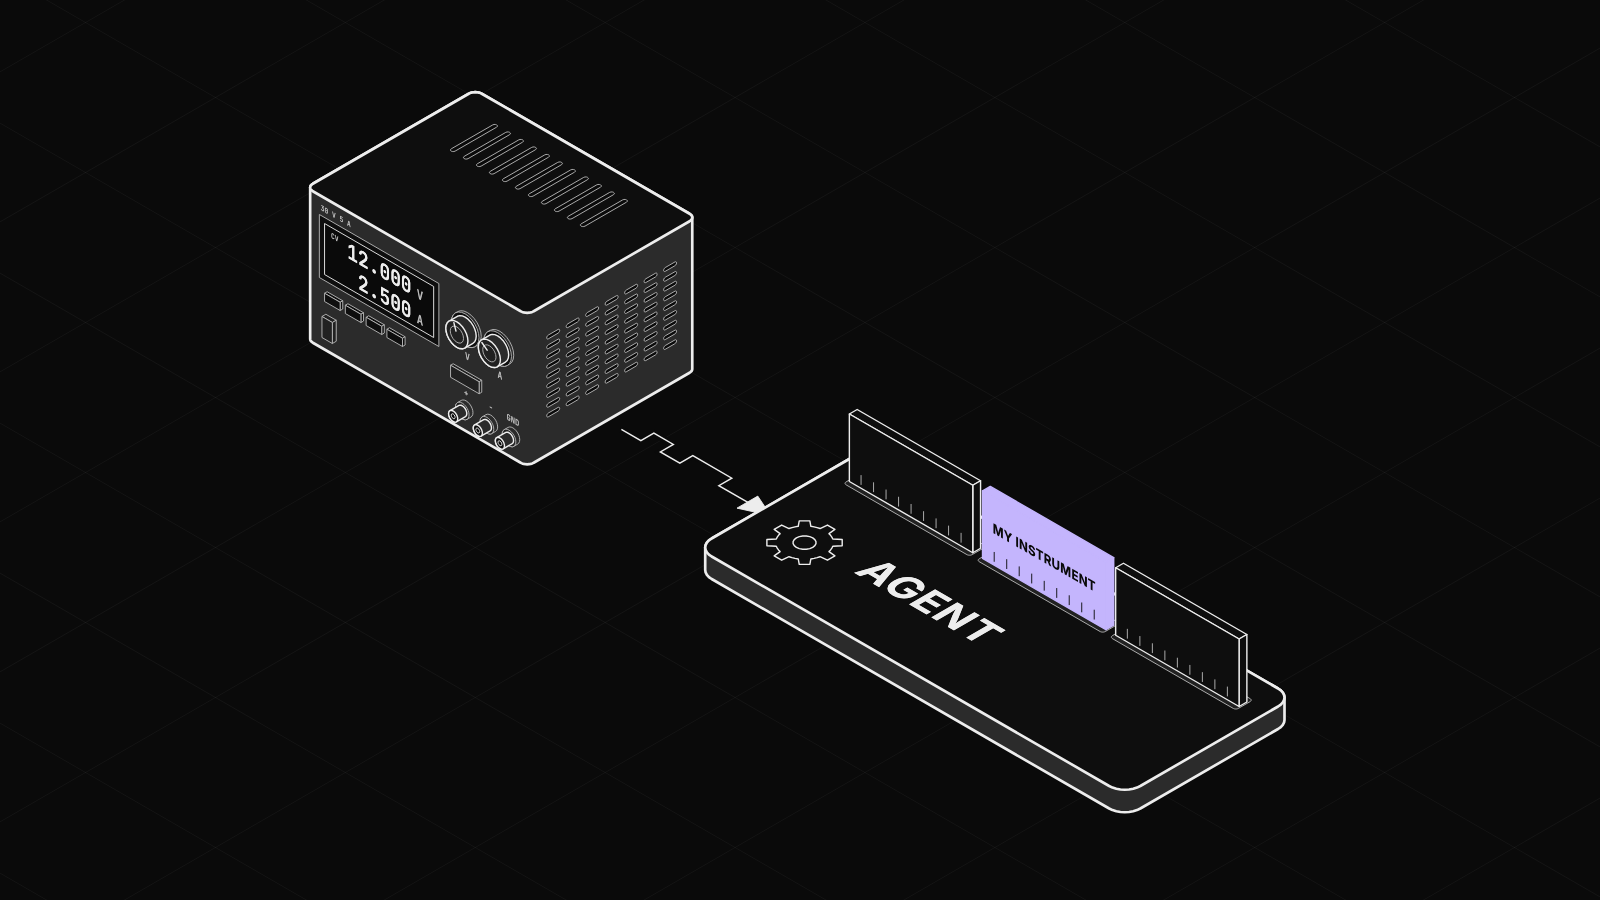
Create an agent extension in the app, stream your instrument's readings, run its action, and change the code with a stop and a start.
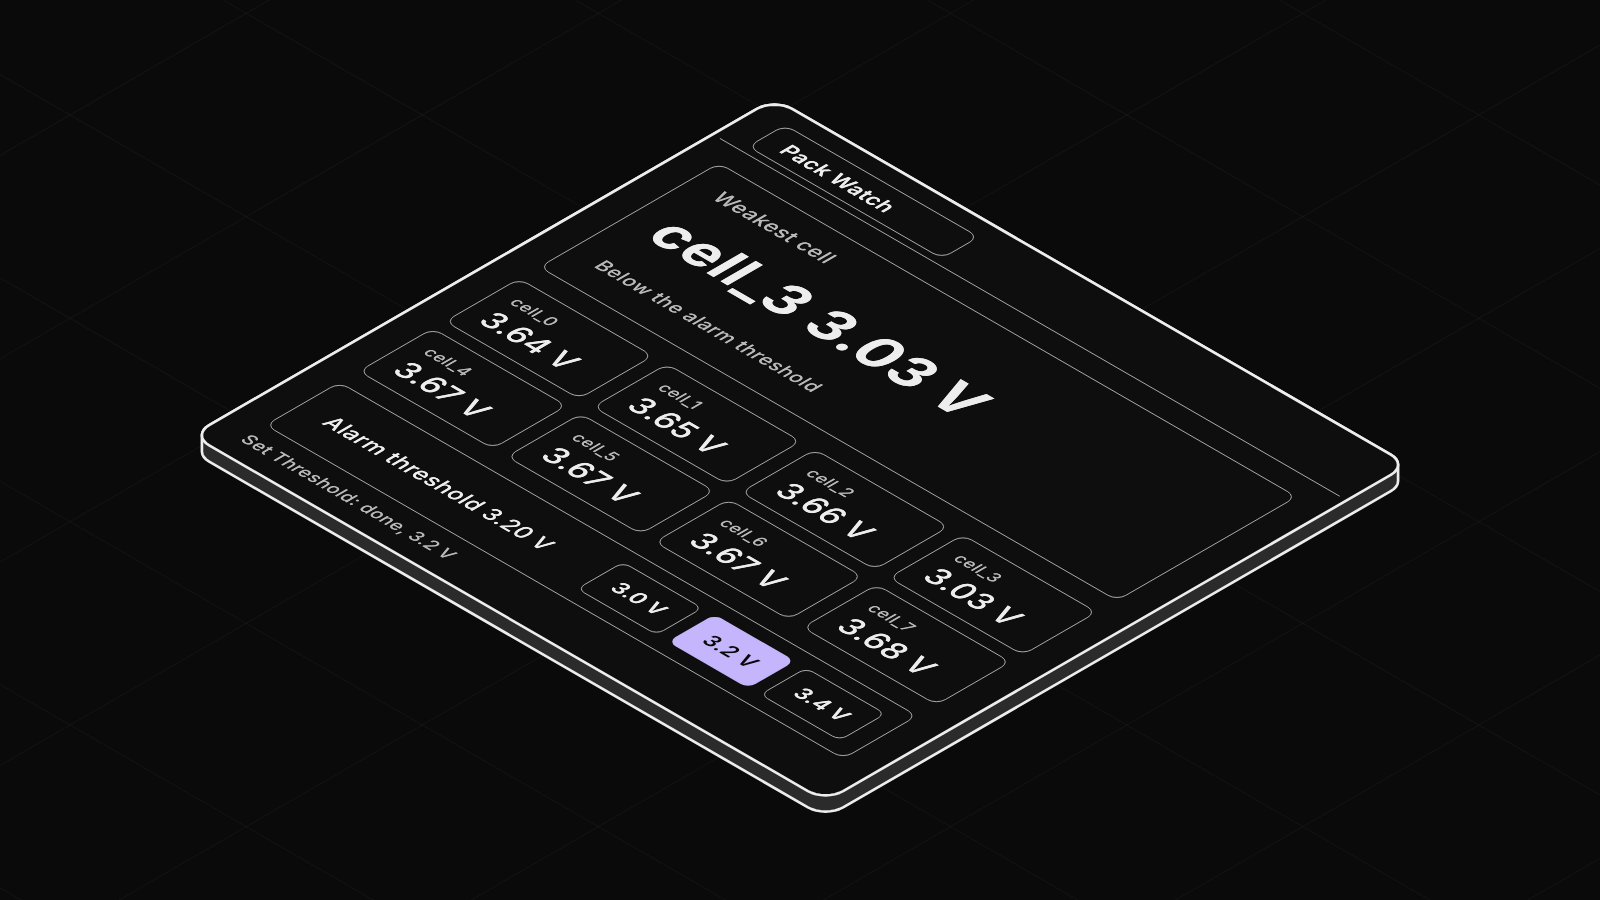
An app extension is a web page that opens as a tab in the desktop app. Build one that watches a battery pack's weakest cell and sets its alarm threshold with an action button.
A notebook is a markdown file with Python cells. Make one, chart a battery pack's cell voltages from live data, and open the plain file it saves.
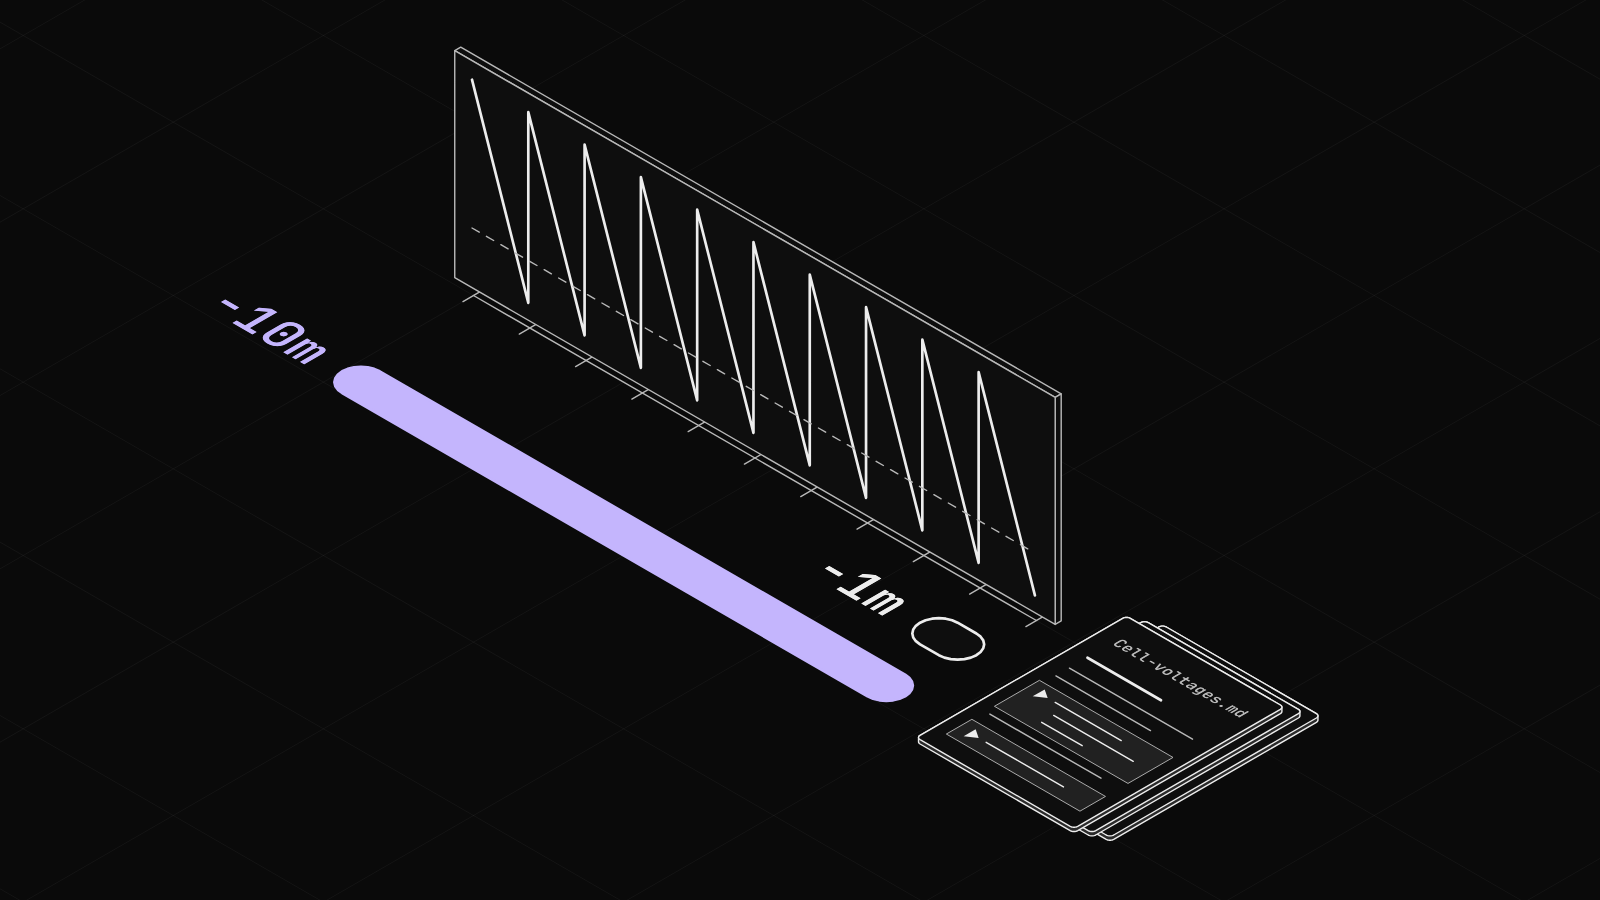
Change a notebook's time window from the sidebar, run it again with Run all, and re-run only the changed cells with Run out-of-date cells.
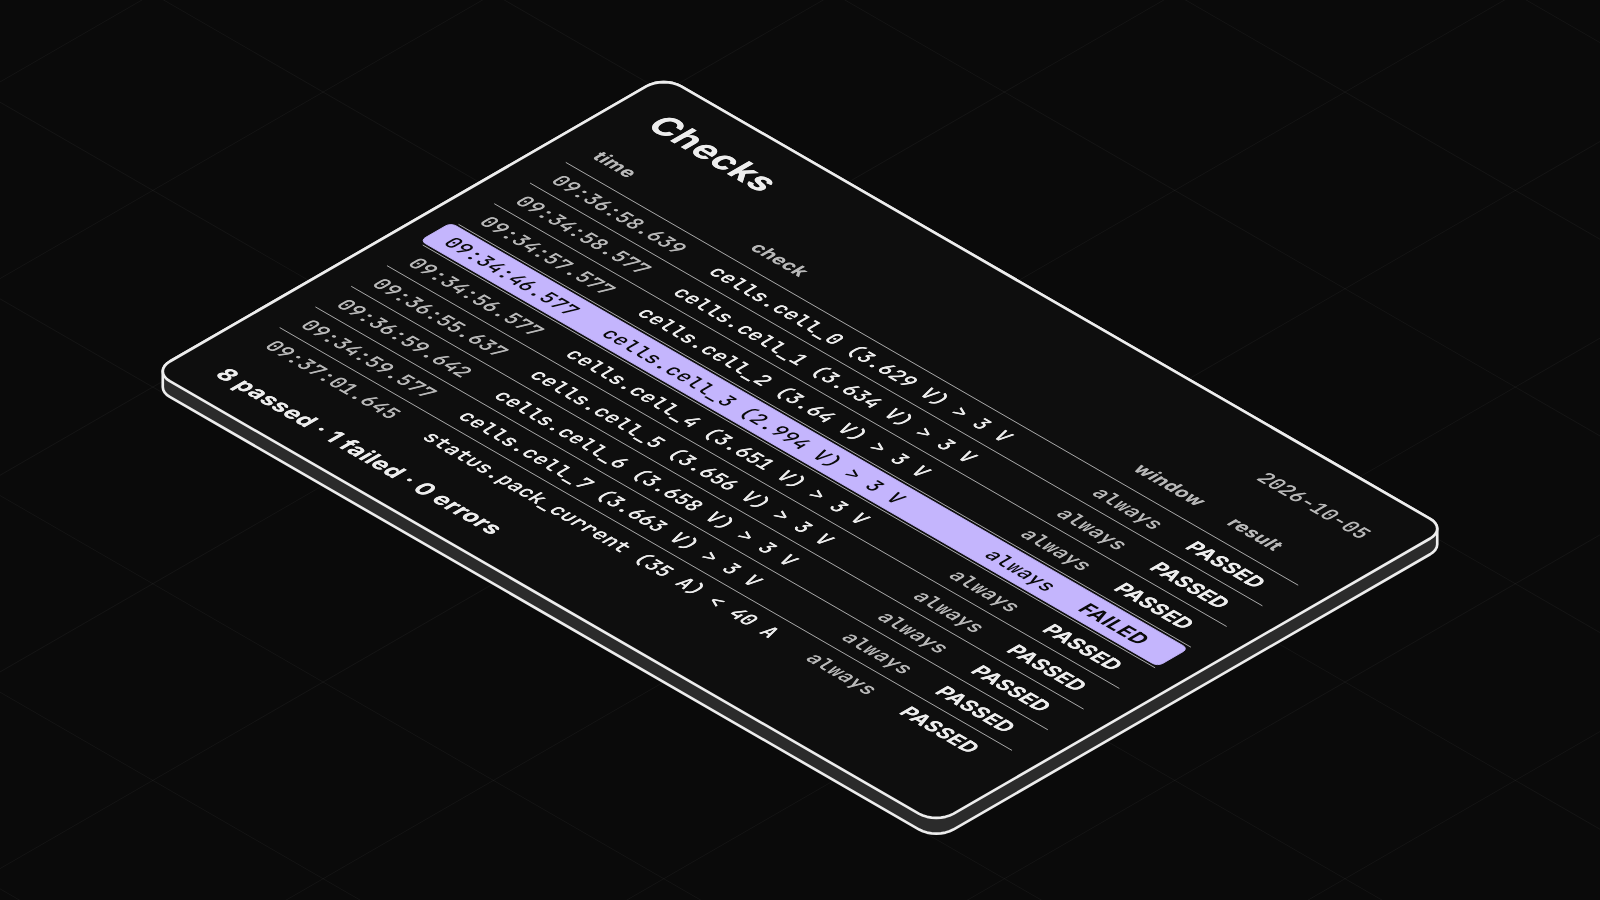
Add rules to a notebook, see every result with the sample that proves it, and make one failing rule fail the whole run.
Publish a notebook with its outputs to Zelos Cloud, add the next version, choose who can open it, and let a teammate read and copy it.
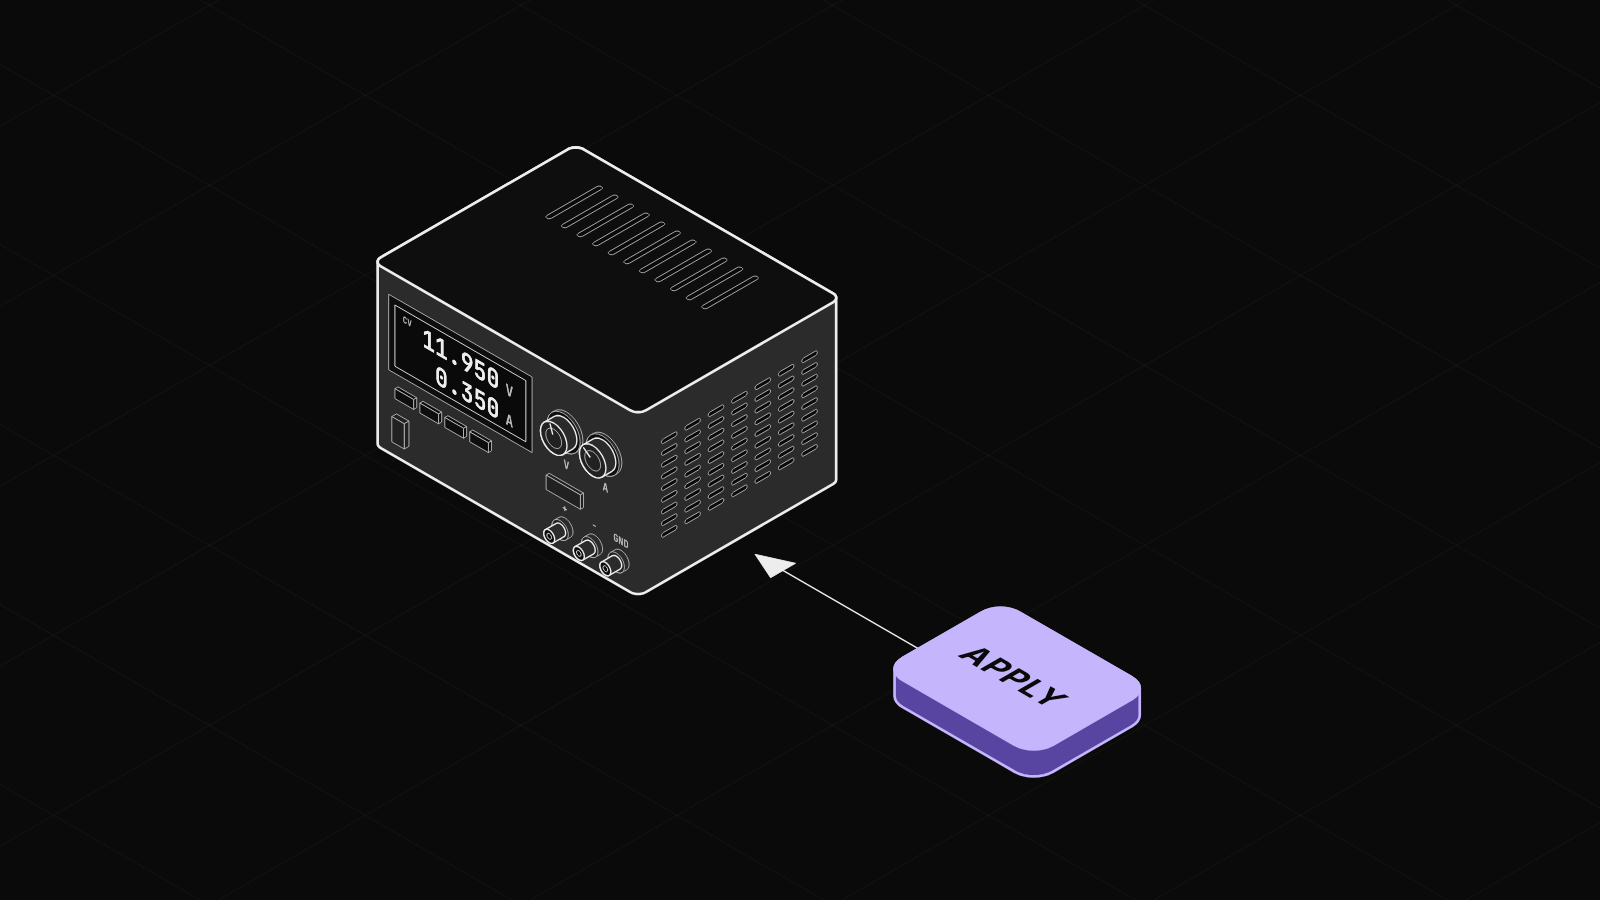
Find an action in Explorer, run it from an Action panel, watch the plot answer, and read a PASS or FAIL verdict. A short script stands in for the bench.
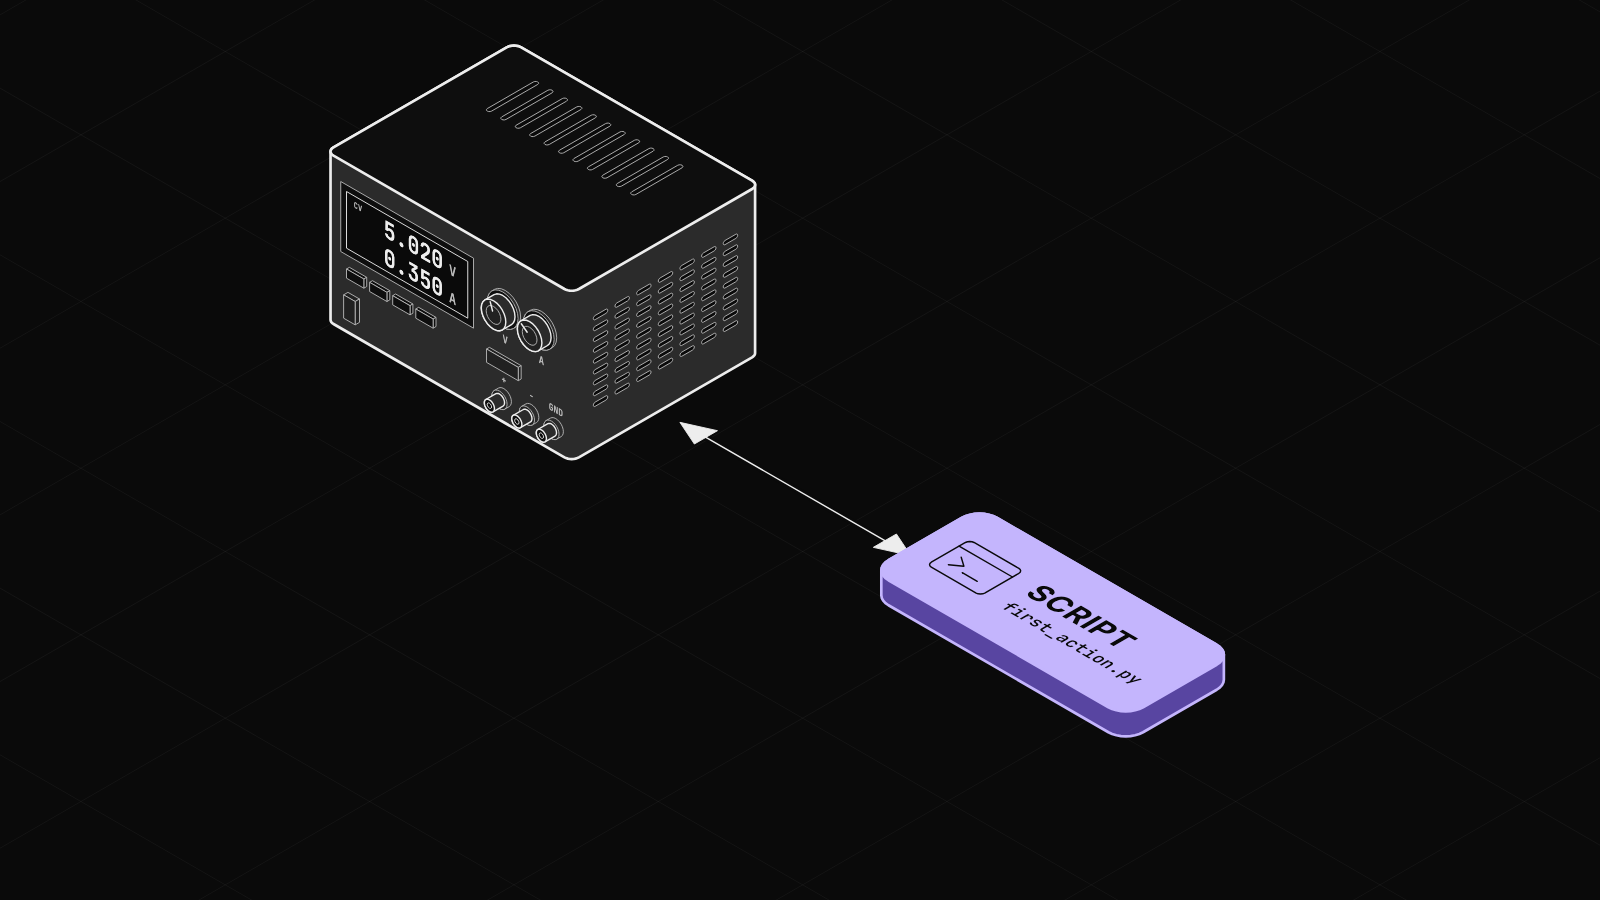
Turn a Python function into a button in the app: a typed form, a result, a pass or fail verdict, and the same call from your own scripts.
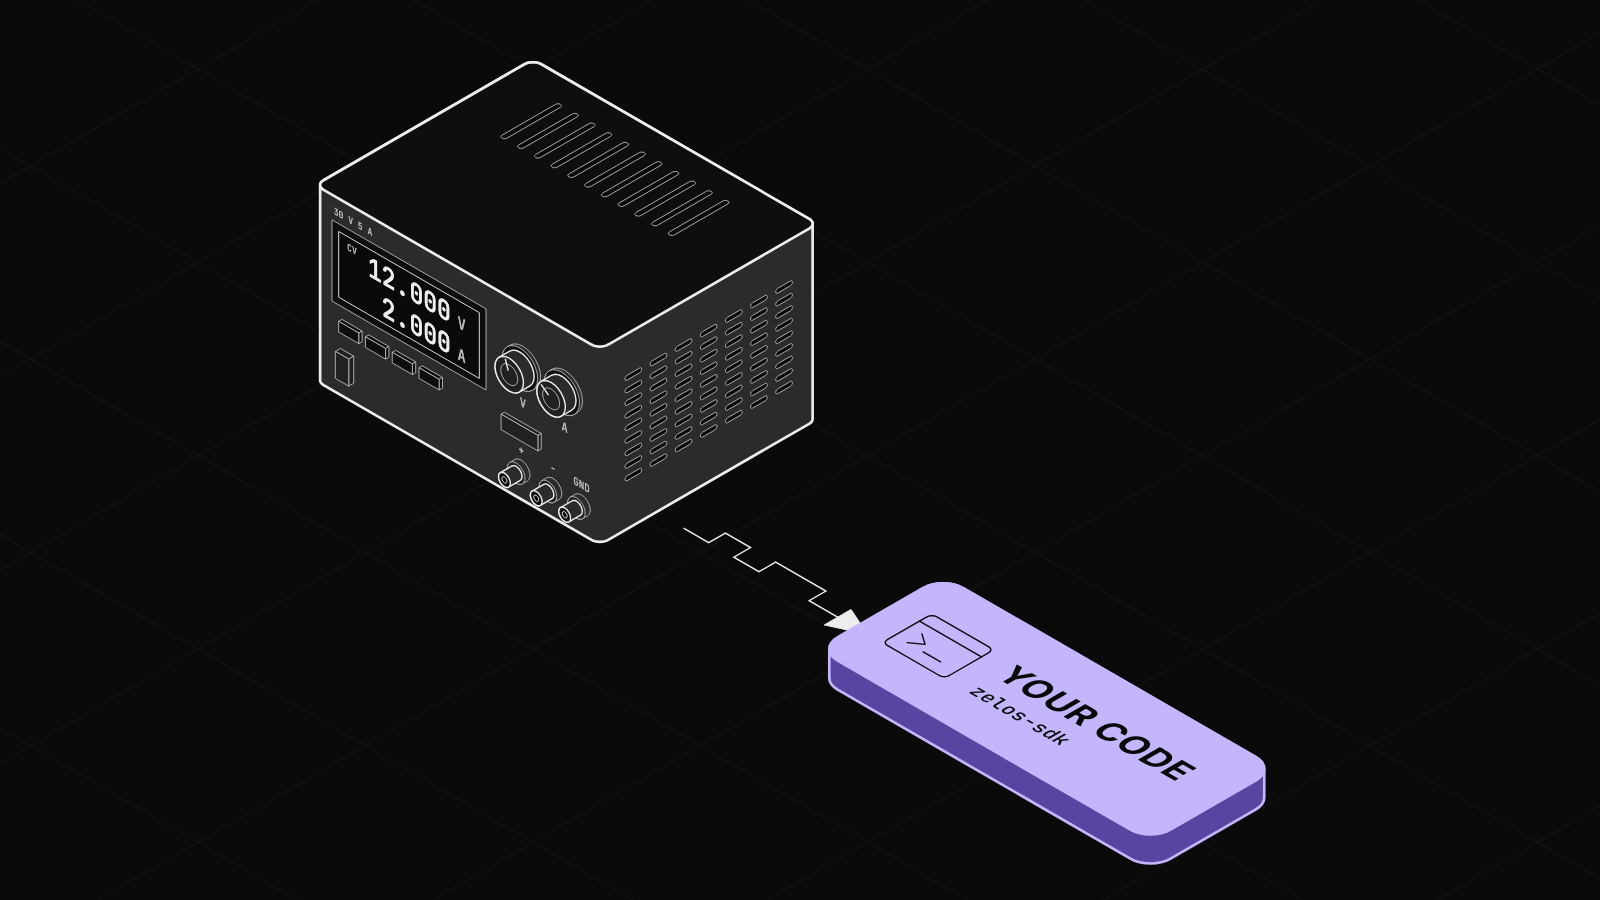
Stream readings from your own code into Zelos with the SDK and plot them live, on one timeline with the rest of your data.
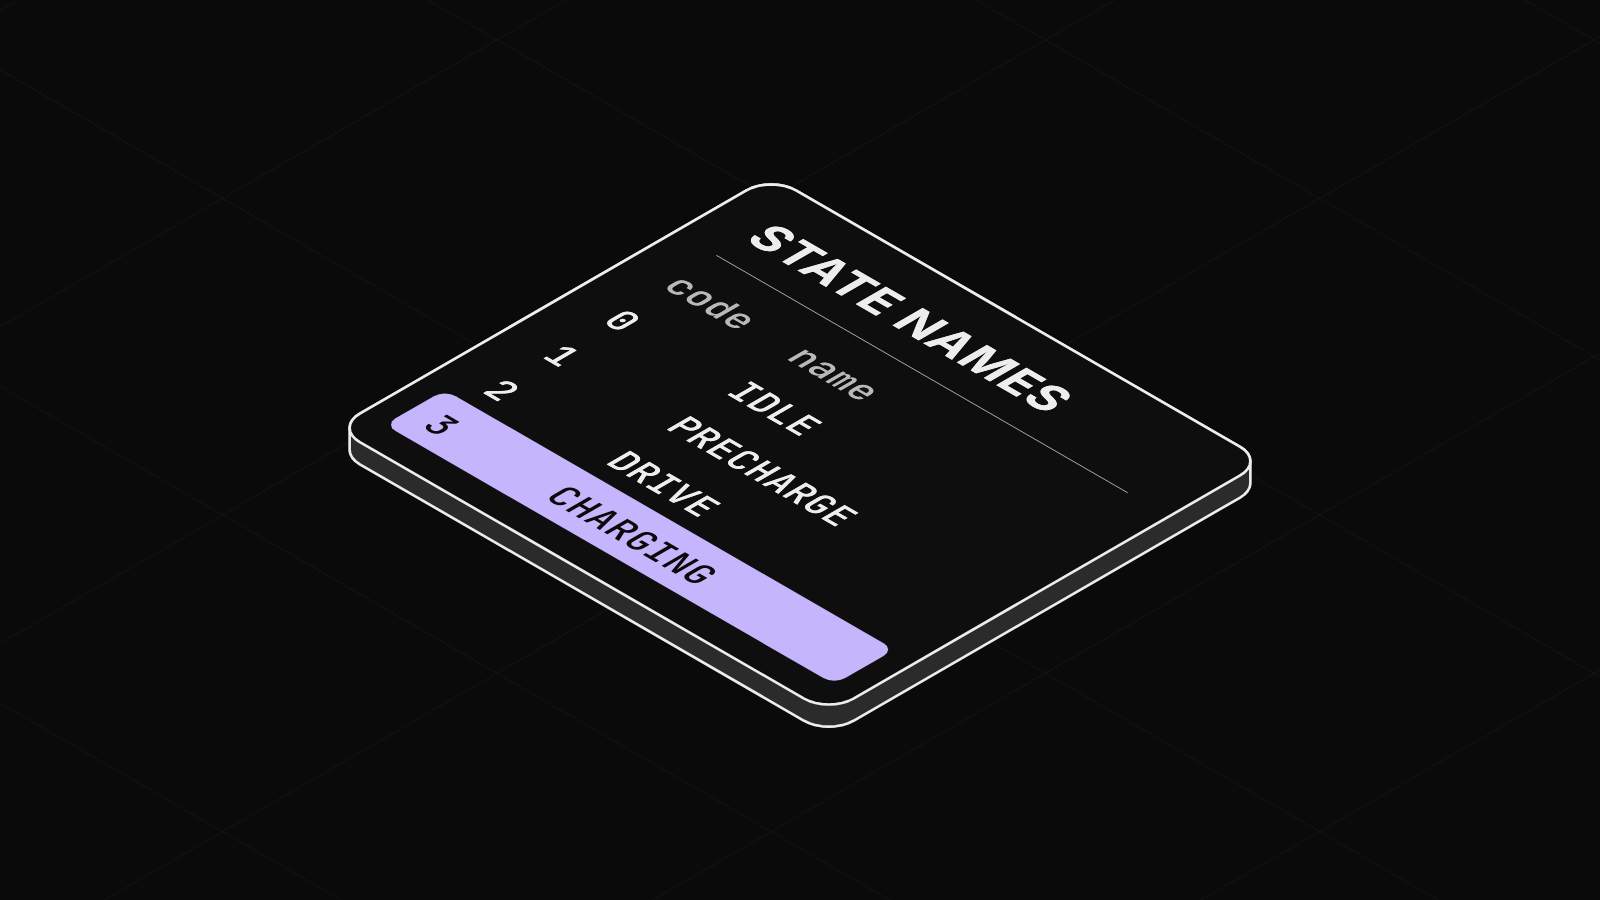
Give your signals units, types and named states once, from a file such as a DBC or from your own code, and every panel in Zelos shows them.
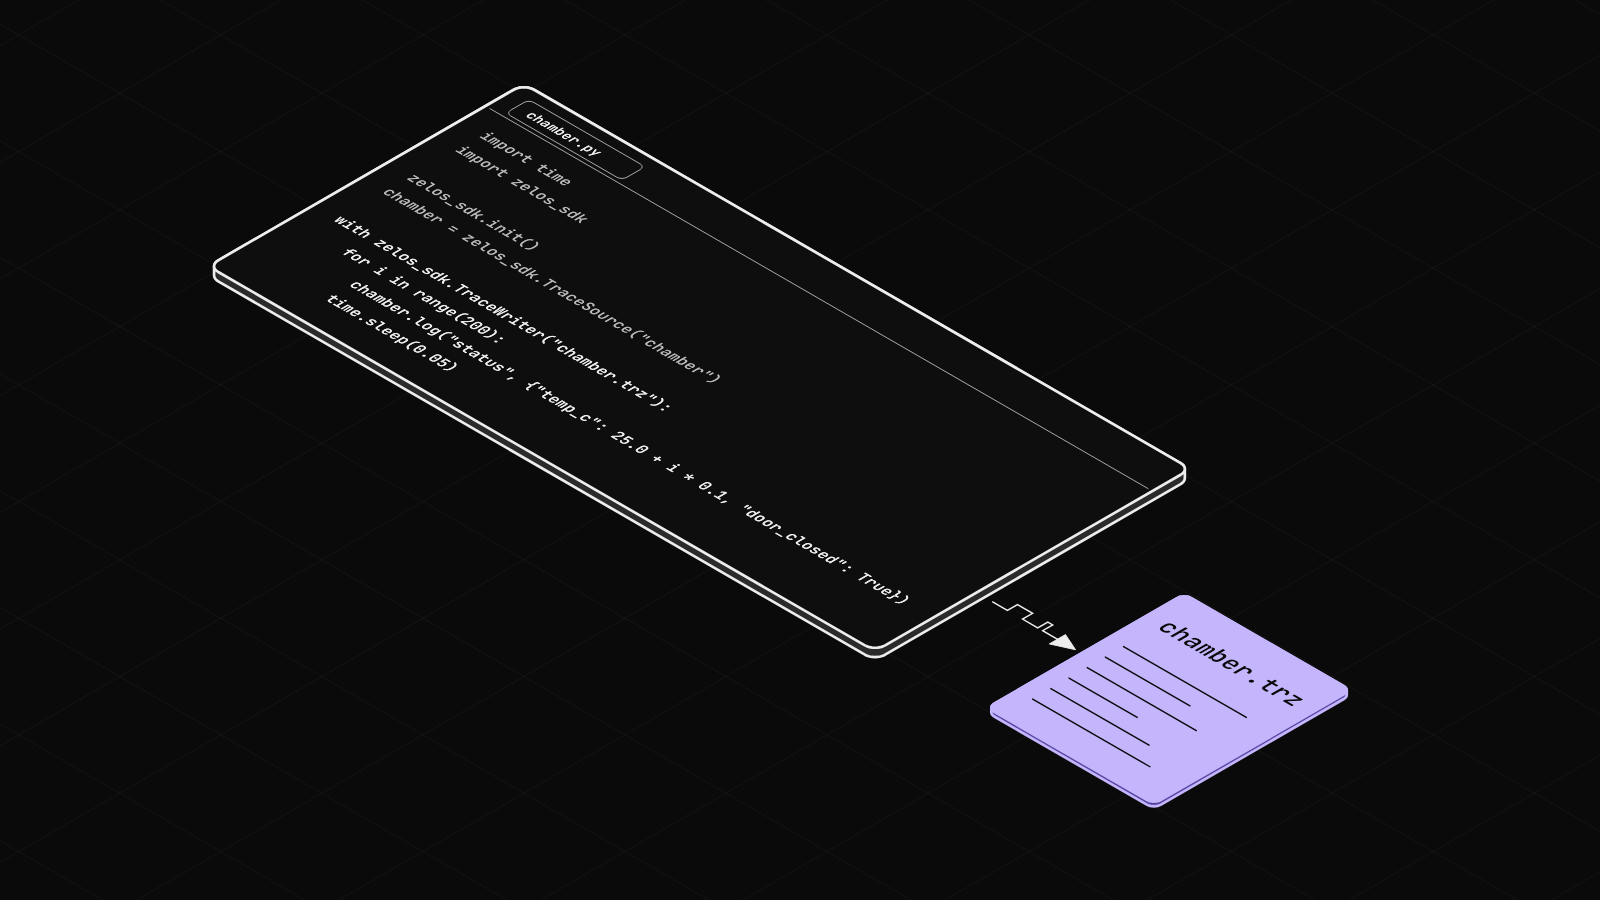
Write a .trz trace from your own Python script, save the minutes before a fault, and open the file in Zelos.
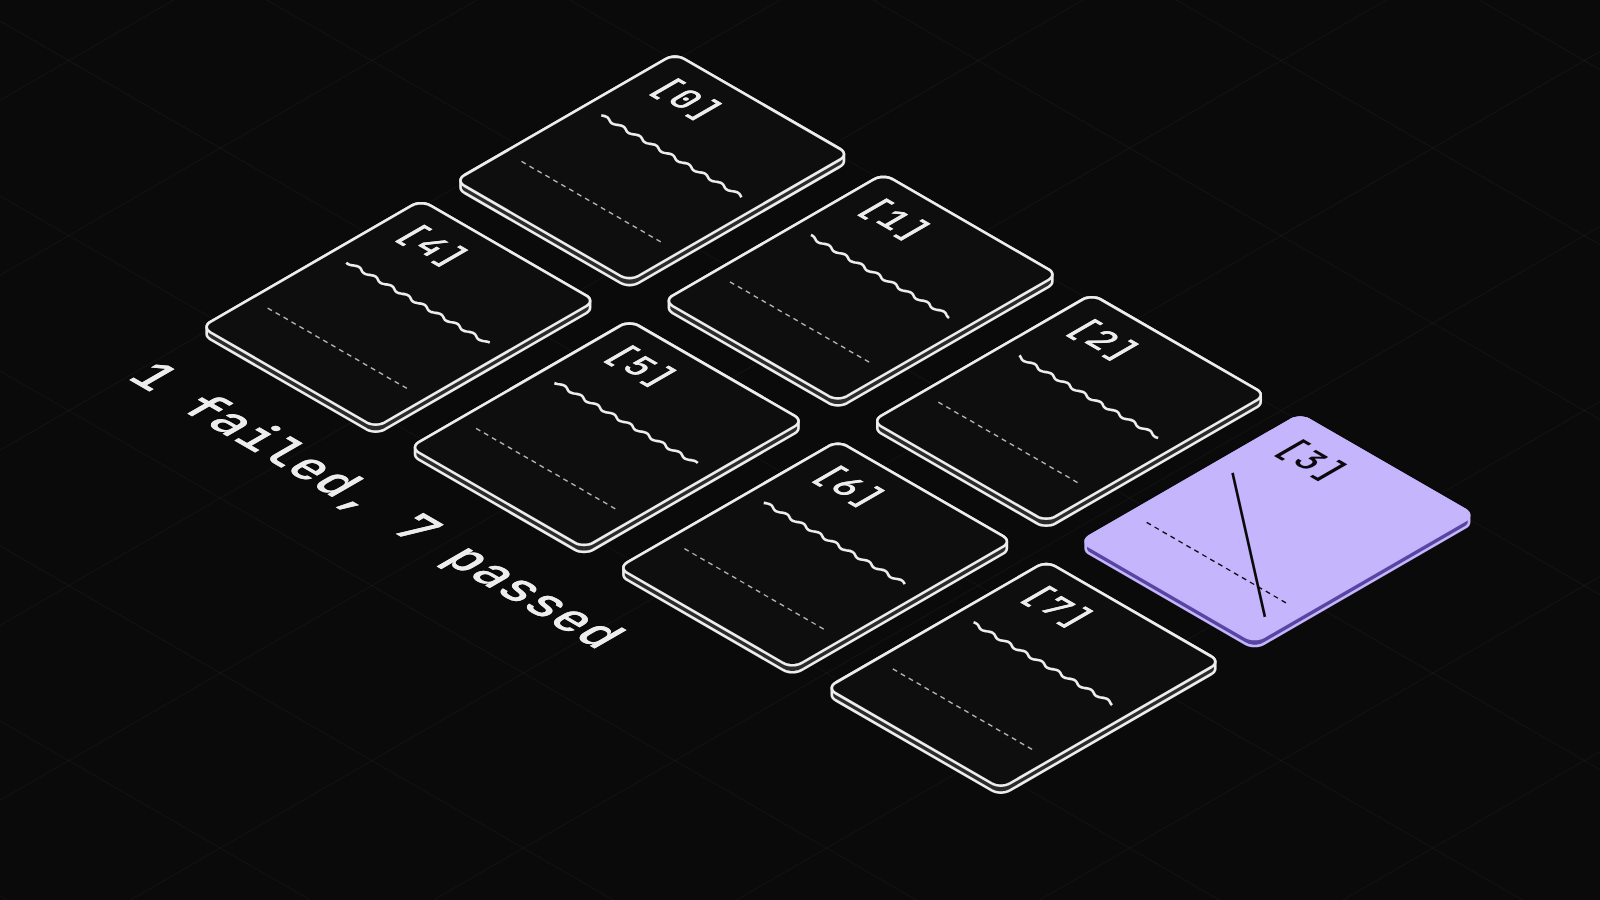
Check live signals from pytest, read which sample broke the rule, and open the failing test's trace in the app.
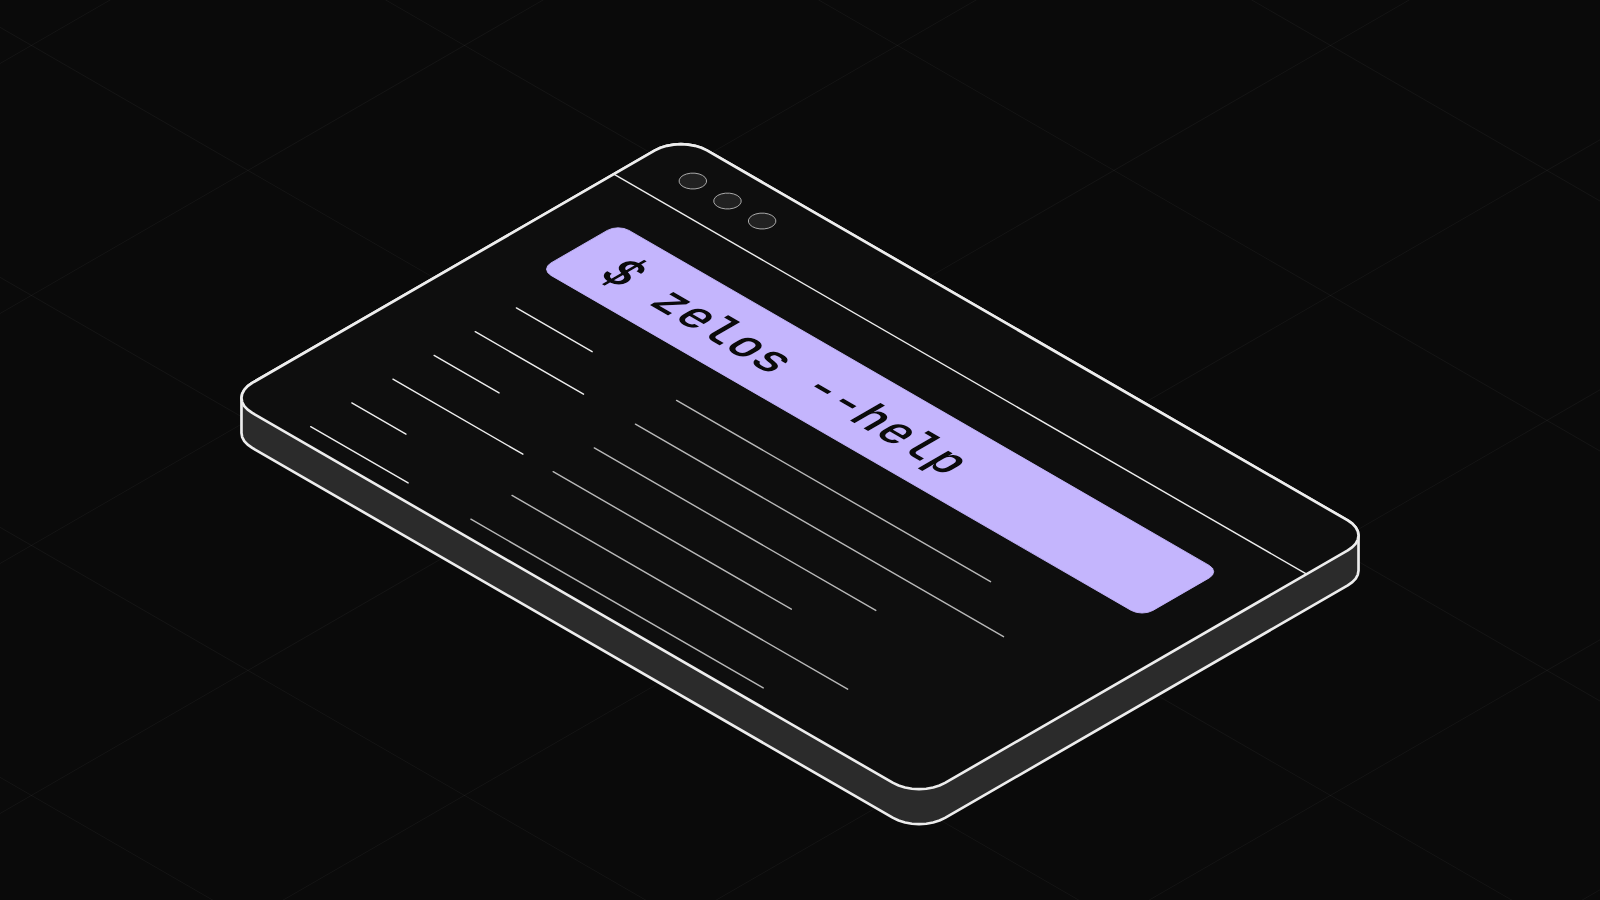
Install the Zelos CLI with one line, see what it does from a terminal, and start simulated data so you can follow the other guides without hardware.