How-ToSDKMade with Zelos app 26.0.9 · SDK 0.0.12
Stream your own measurements with the SDK
Stream readings from your own code into Zelos with the SDK and plot them live, on one timeline with the rest of your data.
Contents9 sections
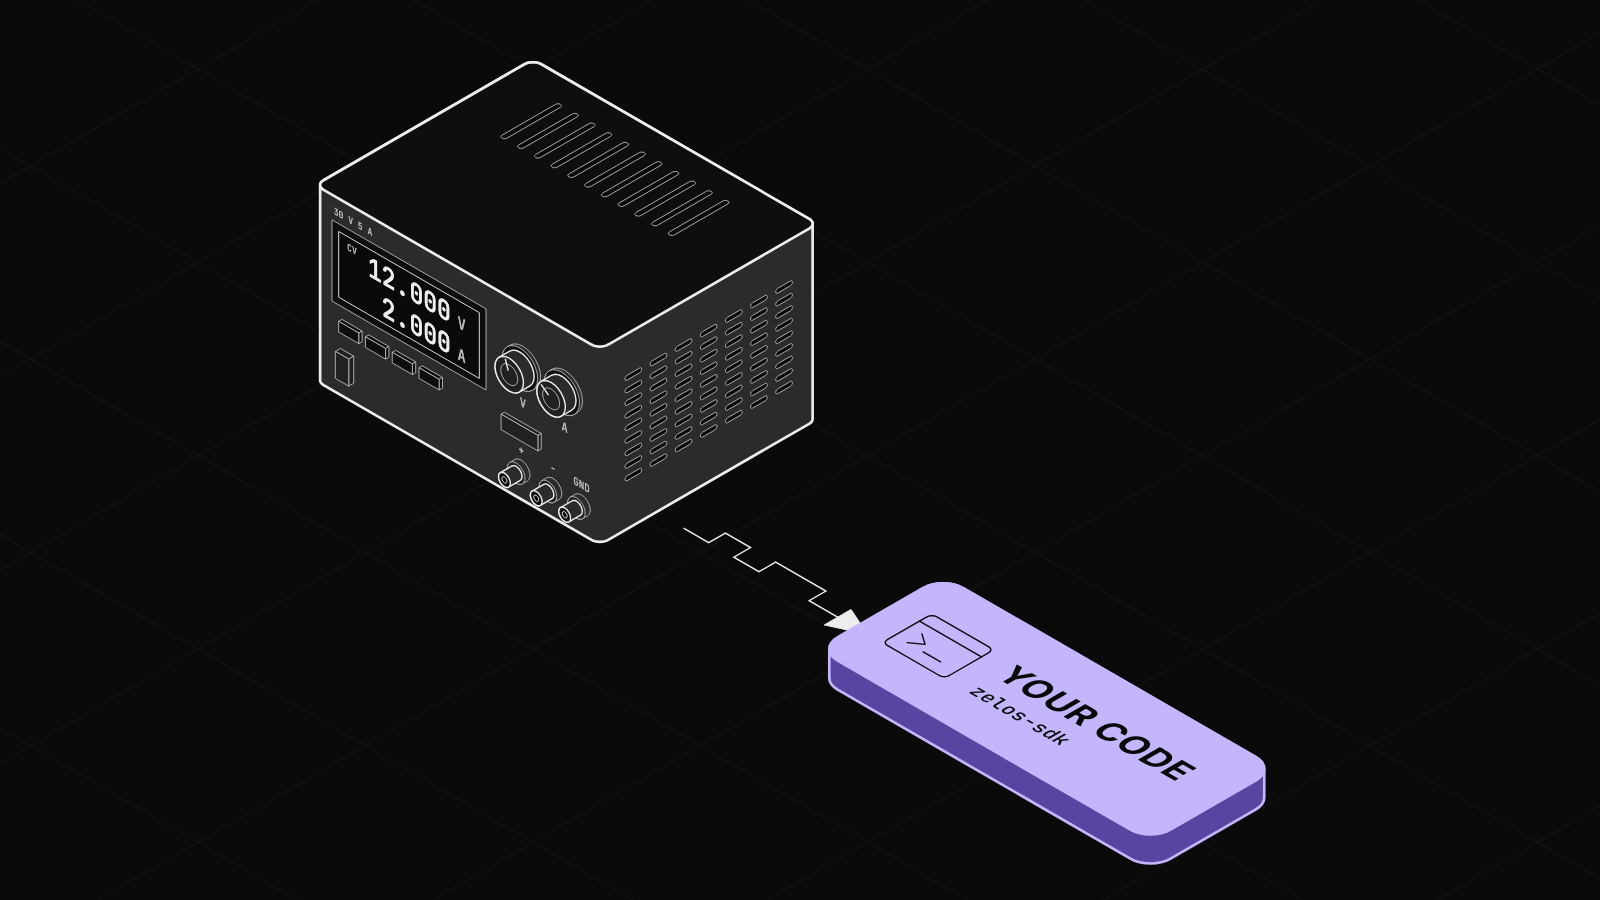
Some readings on your bench have no extension: a supply you poll over USB, a fixture, a number your test script computes. A short script built on the SDK sends them to Zelos, where they plot live on the same timeline as everything else. This guide uses Python. The Rust and Go SDKs work the same way, and the SDK quickstart covers all three.
This guide runs on simulated data. Install the CLI shows how to start it.
Your script sends to the same agent as everything else
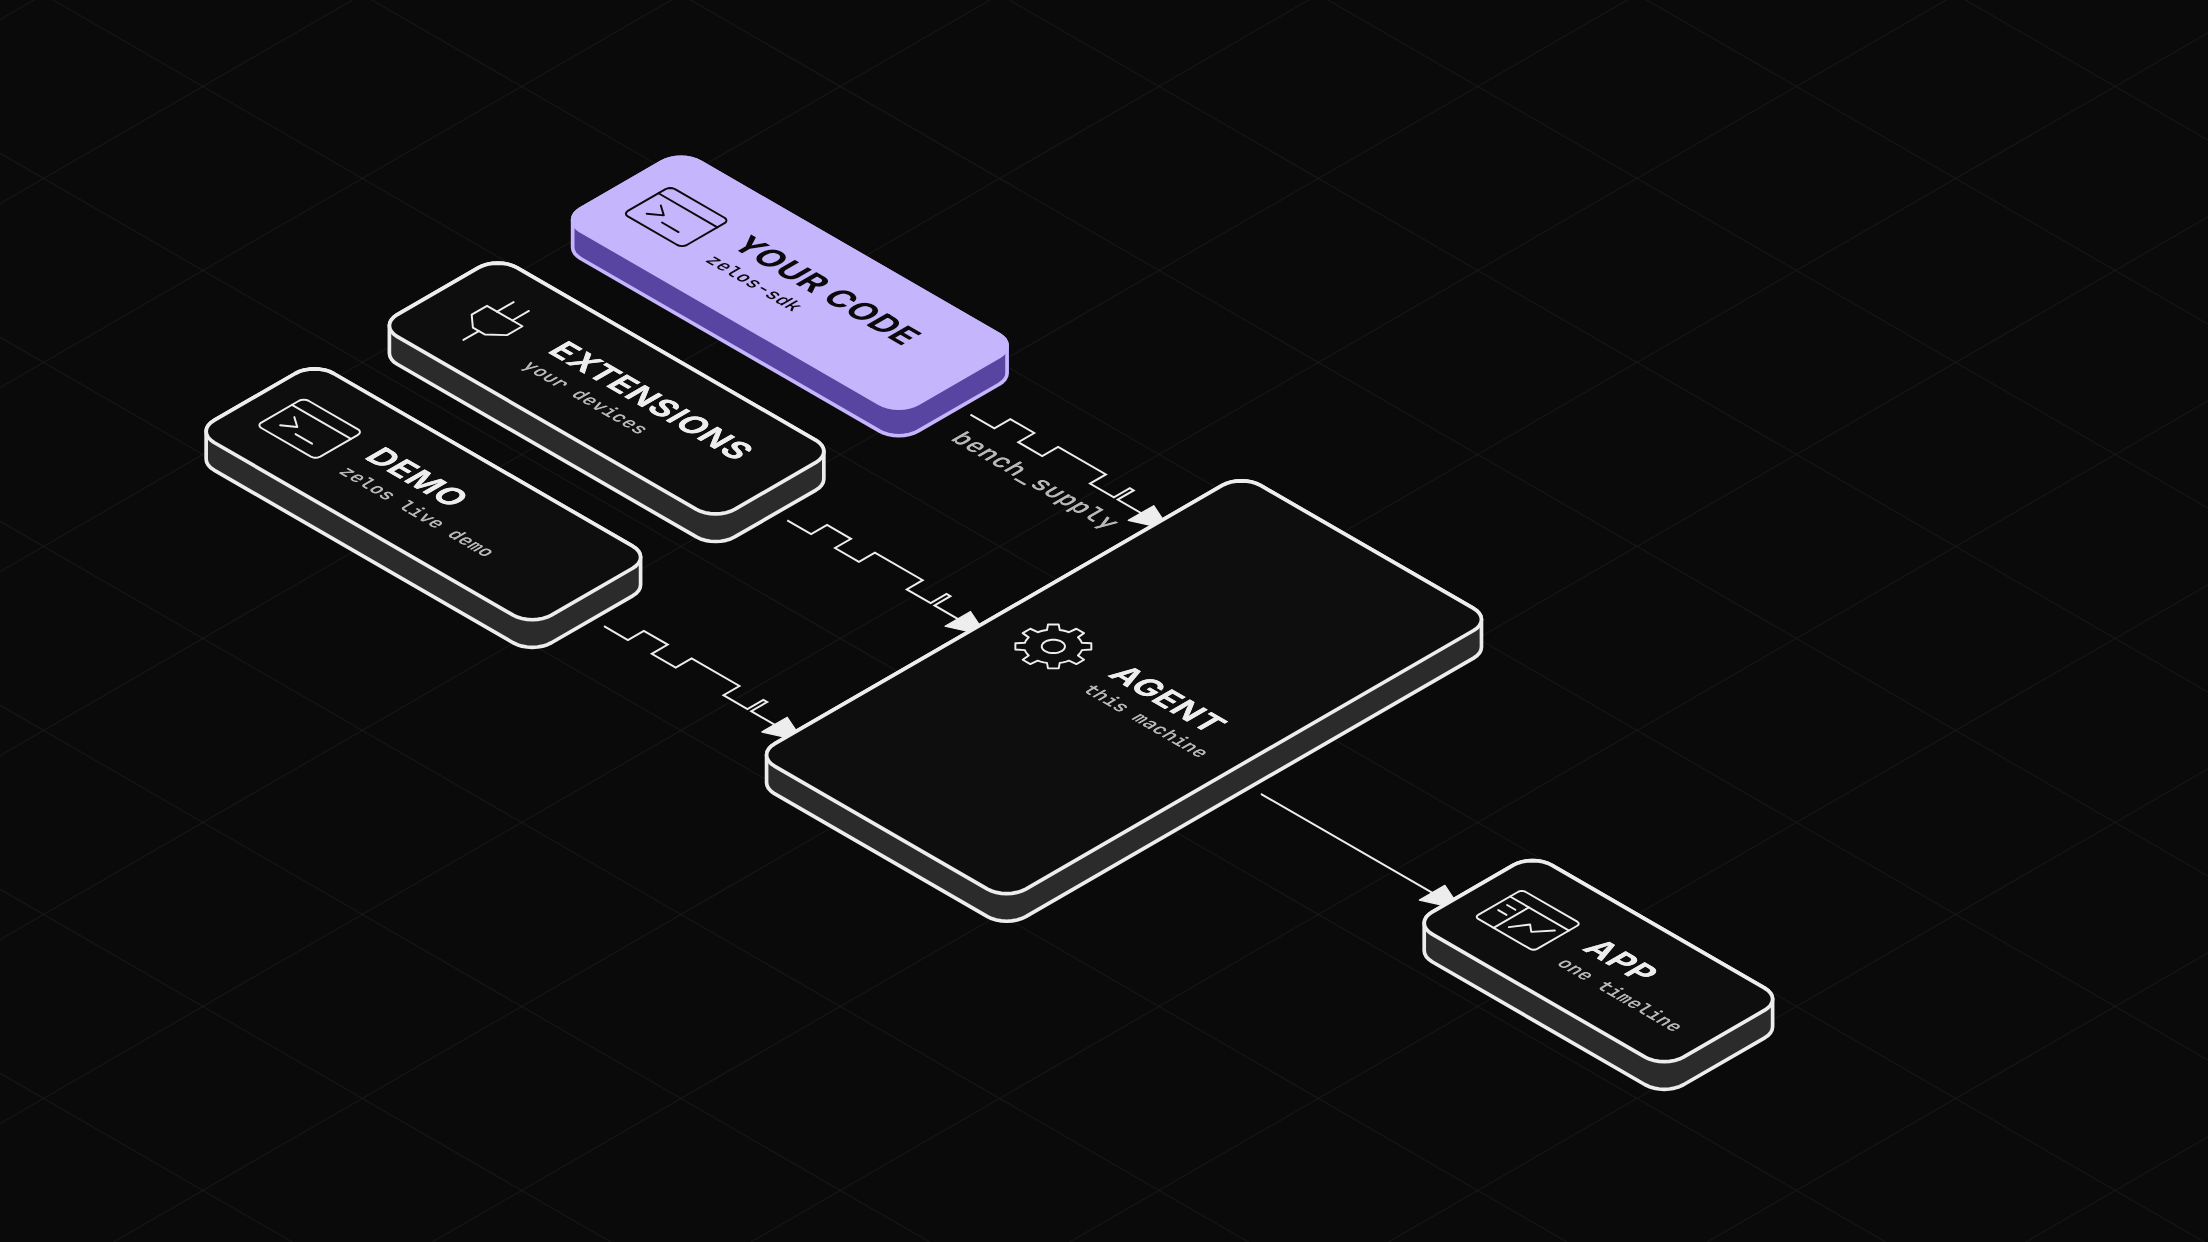
The agent is the program that collects data and serves it to the app. The desktop app runs one on your machine. Extensions feed it, and so can your own code. The zelos-sdk Python package sends values to that agent. The app shows everything the agent holds on one timeline, whatever program sent it.
Three names organize the data. A source is the thing that produces it (bench_supply). An event is one set of readings taken at one instant (output). A field is one value in it (voltage). Each field becomes a signal named source/event.field, here bench_supply/output.voltage.
Before you start
- The Zelos app.
- uv.
- Python 3.10 or newer.
Step 1: Set up a project
Make a project and add the SDK to it:
uv init supply
cd supply
uv add zelos-sdk
Step 2: Write the script
Save this as supply.py in the supply folder, or take it from zelos-examples. The sine waves stand in for your instrument. Replace them with a read from it.
import math
import time

import zelos_sdk

zelos_sdk.init()
supply = zelos_sdk.TraceSource("bench_supply")

while True:
    t = time.time()
    voltage = 12.0 + 0.5 * math.sin(t)
    current = 2.0 + 0.2 * math.sin(t)
    supply.log("output", {"voltage": voltage, "current": current})
    time.sleep(0.01)  # 10 ms between readings
init() connects to the agent on this machine. TraceSource names the producer. Each log() sends one output event with two fields, stamped with the current time. Your loop sets the rate.
Step 3: Run it and find your source
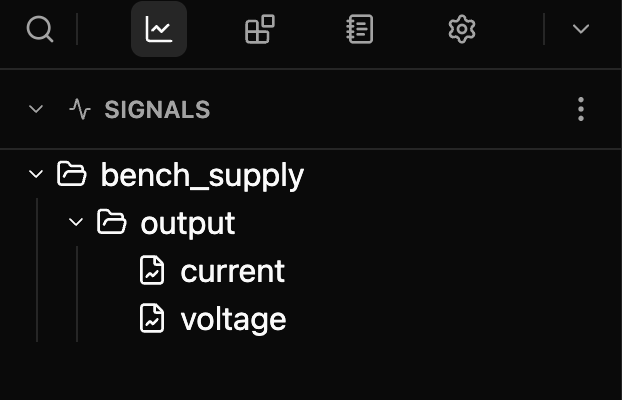
uv run supply.pyLeave it running. In the app, select Explorer in the left rail. Under SIGNALS, bench_supply appears within a couple of seconds. Click it, then output, to see current and voltage.
Step 4: Plot it
Double-click voltage. It opens as a plot, and the line scrolls as readings arrive.

Step 5: Plot it beside other live data
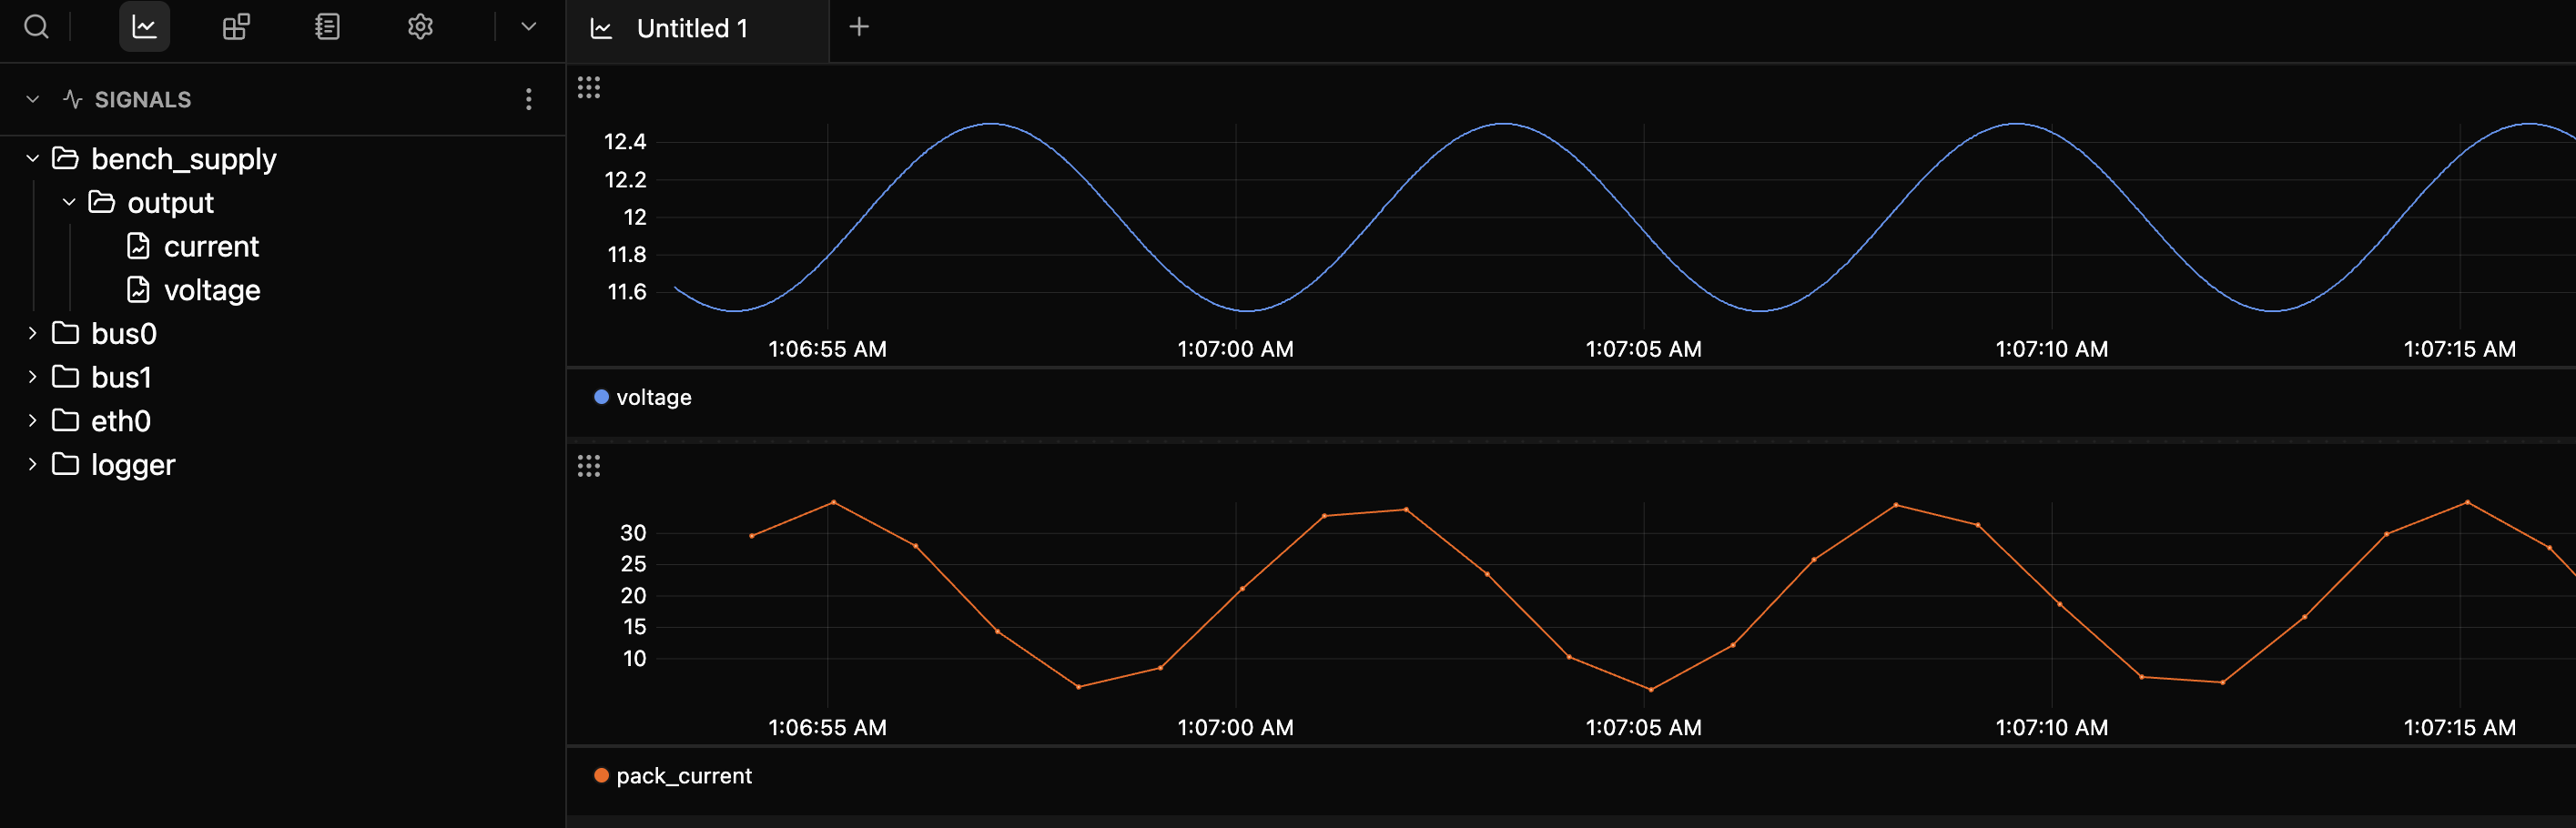
With no hardware connected, the simulated battery pack stands in for the rest of the bench. Its sources join yours in Explorer. Select the search icon at the top left of the rail (Cmd+F, or Ctrl+F on Windows and Linux), type pack_current, and double-click the result. The pack current opens as a second plot in the same tab, under your voltage, on the same time axis.
Send to a bench PC instead
To send to an agent on another machine, set its address on the line you run the script with:
ZELOS_AGENT_URL=grpc://<host>:2300 uv run supply.pyThe other agent must listen on the network: set Agent Bind Address to All interfaces under Settings > Network in its app, then restart it. The app settings and the SDK quickstart have the details.
Next: give the signals units
Swap the sine for one real read from your bench instrument, and run it. Then define their units and states up front.