How-ToSDKMade with Zelos app 26.0.9 · SDK 0.0.12
Run bench tests with pytest and open the failure
Check live signals from pytest, read which sample broke the rule, and open the failing test's trace in the app.
![Eight trace files, one per test, each a cell voltage over a dashed 3.0 V floor; file [3] is violet, and its line drops below the floor. The run reads 1 failed, 7 passed.](/blog/hardware-tests-with-pytest/cover.png)
Contents7 sections
A failed bench test gives you a message, and you also want the data behind it. This guide checks live signals from pytest, saves one trace per test, and opens the failing test's trace in the app so you can see what the signal did.
This guide runs on simulated data. Install the CLI shows how to start it.
How it fits together
The agent is the program that collects your bench's signals. The Python SDK adds a pytest plugin with a check fixture. Each check sends a rule to the agent, which judges it against the signals it holds. After each test, a short fixture asks the agent to save that test's data as a trace. The failing test's trace opens in the app.
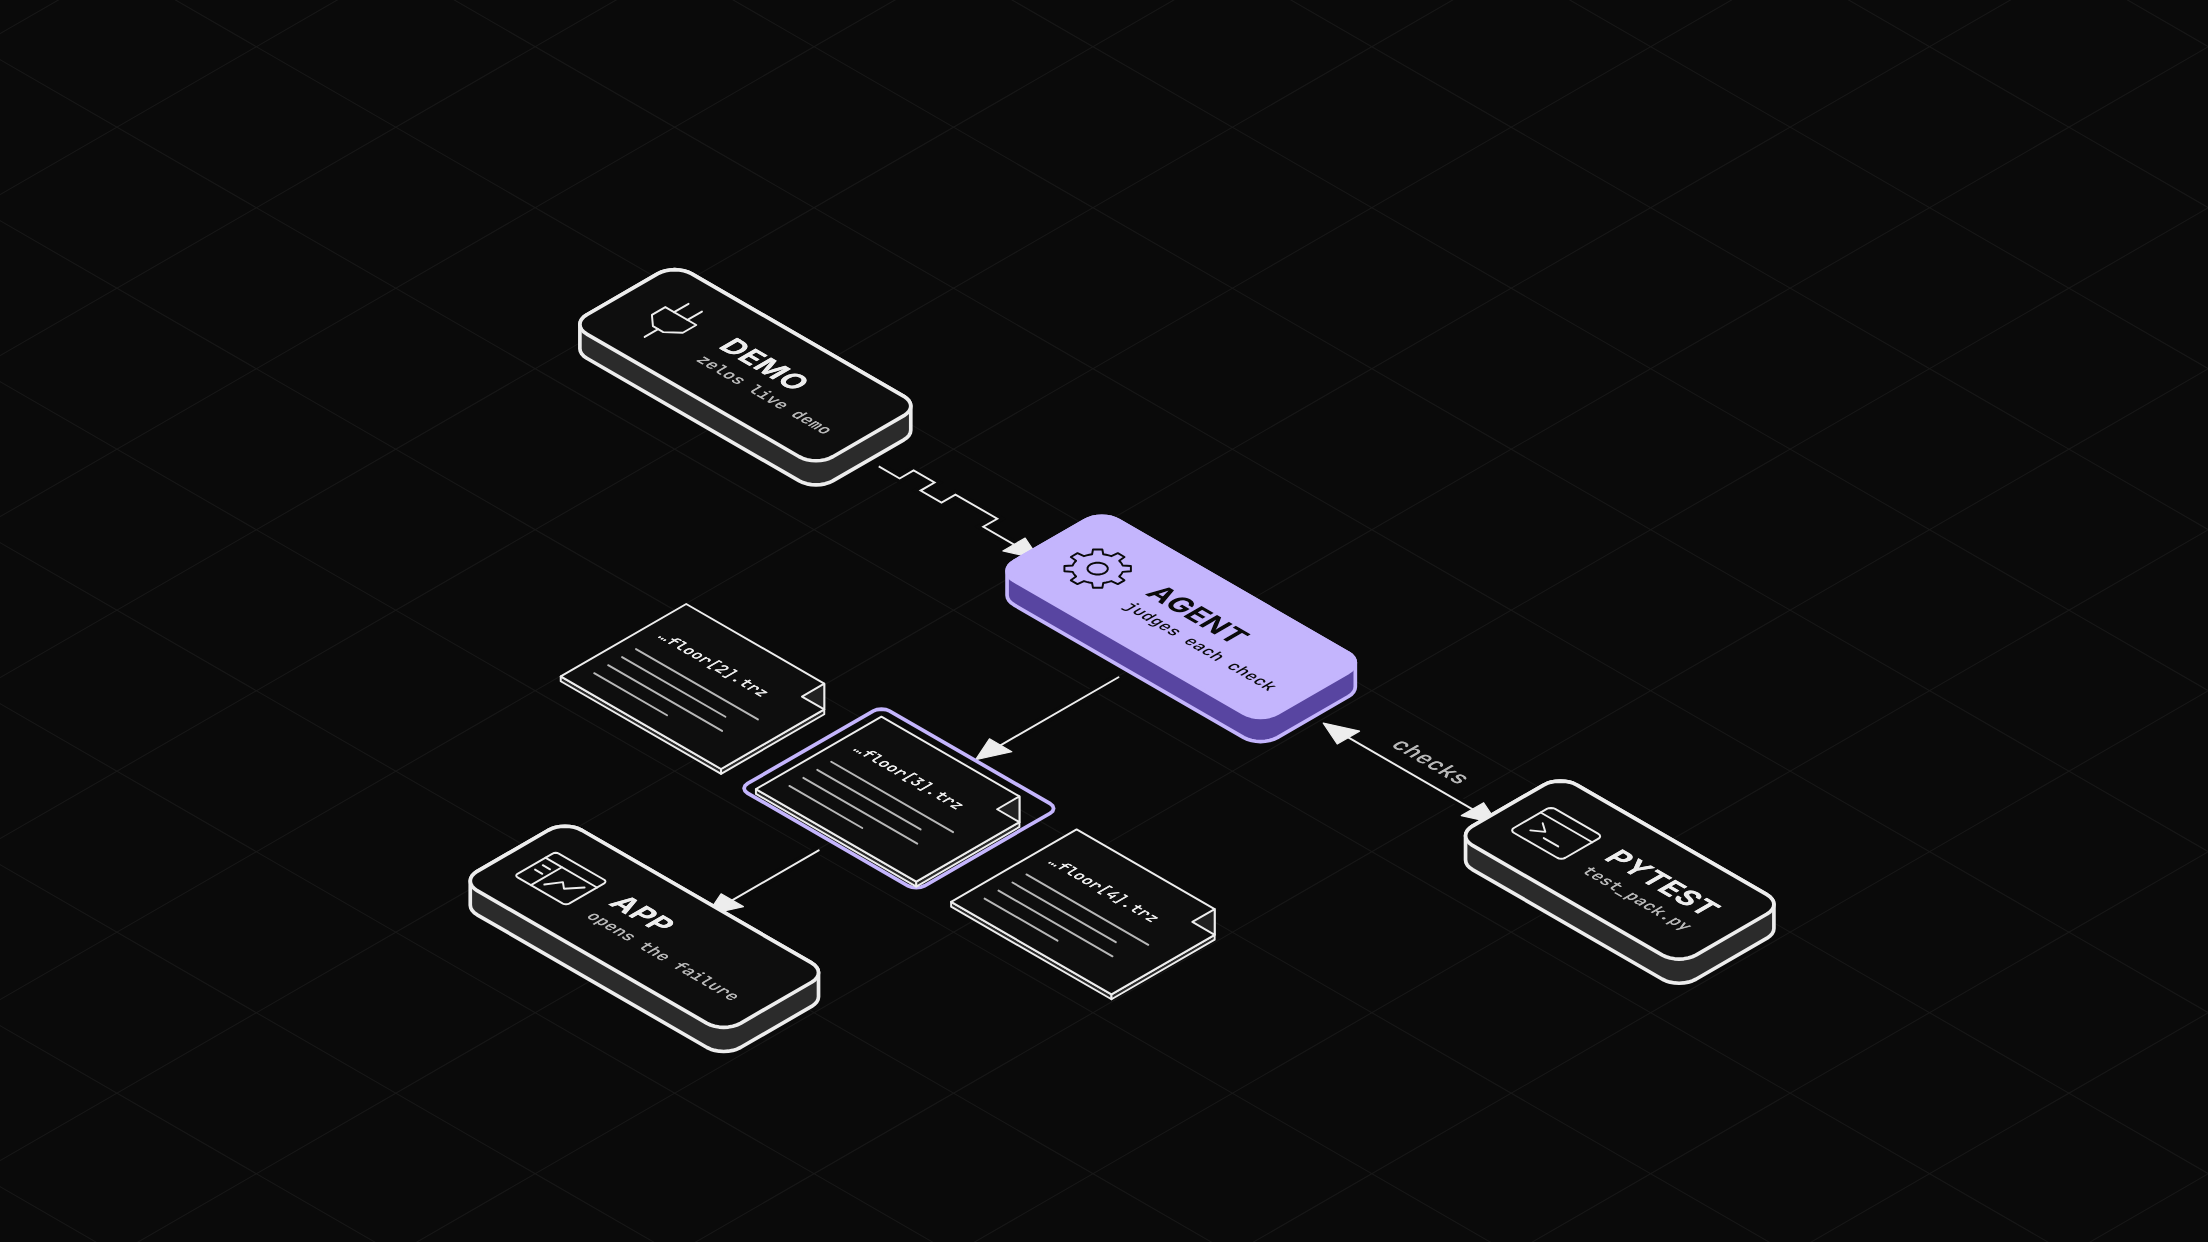
A simulated battery pack stands in for hardware. On a real bench, an extension or your own code feeds the agent instead.
Before you start
- The Zelos app.
- uv.
Step 1: Write the test and run it
Make a project and add the SDK with its test extra, which brings pytest and rich. The plugin loads by itself.
uv init bench
cd bench
uv add "zelos-sdk[test]"
The test checks that every cell stays above 3.0 V.
import pytest

@pytest.mark.parametrize("cell", range(8))
def test_cell_above_floor(agent, check, cell):
    voltage = agent.signal(f"bus0/BMS_message/cells.cell_{cell}")
    check.that(voltage, ">", 3.0, last="60s")
last="60s" makes the rule hold for every sample in the last 60 s. Eight parameters make eight tests. In this example, cell_3 dips under 3.0 V near the end of every minute.
Run uv run pytest in the bench folder. Seven cells pass and cell 3 fails. This output comes from a run with the step 2 files in place, cut to the lines that matter:
test_pack.py::test_cell_above_floor[2] PASSED                                                [ 37%]
test_pack.py::test_cell_above_floor[3] FAILED                                                [ 50%]
---------------------------------------- live log teardown -----------------------------------------
INFO     zelos-checker:board.py:111
                           Zelos Checkerboard
                        test_cell_above_floor[3]
┏━━━━━━━━━━━━━━━━━━━━━━━━━┳━━━━━━━━━━━━━━━━━━━━━━━━━━┳━━━━━━━━┳━━━━━━━━┓
┃          time           ┃          check           ┃ window ┃ result ┃
┡━━━━━━━━━━━━━━━━━━━━━━━━━╇━━━━━━━━━━━━━━━━━━━━━━━━━━╇━━━━━━━━╇━━━━━━━━┩
│ 2026-10-06 18:20:46.337 │ cells.cell_3 (2.999) > 3 │ always │ FAILED │
└─────────────────────────┴──────────────────────────┴────────┴────────┘
...
=================================== 1 failed, 7 passed in 1.37s ====================================
The table names the first sample that broke the rule: 2.999 V.
Step 2: Save a trace for every test
Two pieces save each trace. The first is pytest.ini.
[pytest]
addopts = --zelos-trace --zelos-local-artifacts-dir=artifacts
log_cli = true
log_cli_level = INFO
--zelos-trace connects the run to the agent's data stream. --zelos-local-artifacts-dir keeps one results file per test in artifacts, and every check in a test runs before the test fails. log_cli prints each test's result table.
The second is a short fixture that saves each test's data from the agent as a trace. A local export needs a paid plan. Record a trace file from your own Python script covers export.
from datetime import datetime, timedelta, timezone
import pytest

@pytest.fixture(autouse=True)
def bench_trace(request, agent):
    start = datetime.now(timezone.utc) - timedelta(seconds=60)
    yield
    path = request.config.zelos_local_artifacts_dir / f"{request.node.name}.trz"
    agent.export(str(path), start=start, overwrite=True)
The export starts 60 s before the test, to match the check's window. After a run, artifacts holds a .trz and a .checks.json per test.
Step 3: Open the failing test's trace
On Home, choose Open trace and pick test_cell_above_floor[3].trz. With an agent connected, choose Open trace, then File, in Data on the right. The trace opens as its own workspace.
Search the signal tree for cells and drag the cells folder onto the empty tab, then drag the plot's bottom corner down to give it room. Cell 3 slides below 3 V near the end of the minute. Right-click the dip, and the legend shows each cell at the cursor. Cell 3 reads 2.908 V there, and the other cells read about 3.6 V.
Before you use it on your bench
- The window needs data. A check on a signal with no data in its window fails.
- A remote agent needs two flags:
--zelos-agent-urland--zelos-trace-url.
Point it at your bench
Copy the files from zelos-examples, swap the cell paths for your own signals, and set your real limit. The testing docs list every plugin option, and the checks page covers windows and operators. To look at the data while you write the rules, turn a notebook into a pass/fail test instead.