How-ToThe appMade with Zelos app 26.0.9
Find your way around the app
A tour of the desktop app in the order you meet it: Home, data sources, Explorer, tabs and panels, the timeline, traces, layouts, and the sidebar views.
Contents12 sections
The desktop app is where you look at your hardware's data, live or recorded. This tour shows each part of the window in the order you meet it, what it is for, and which guide goes deeper.
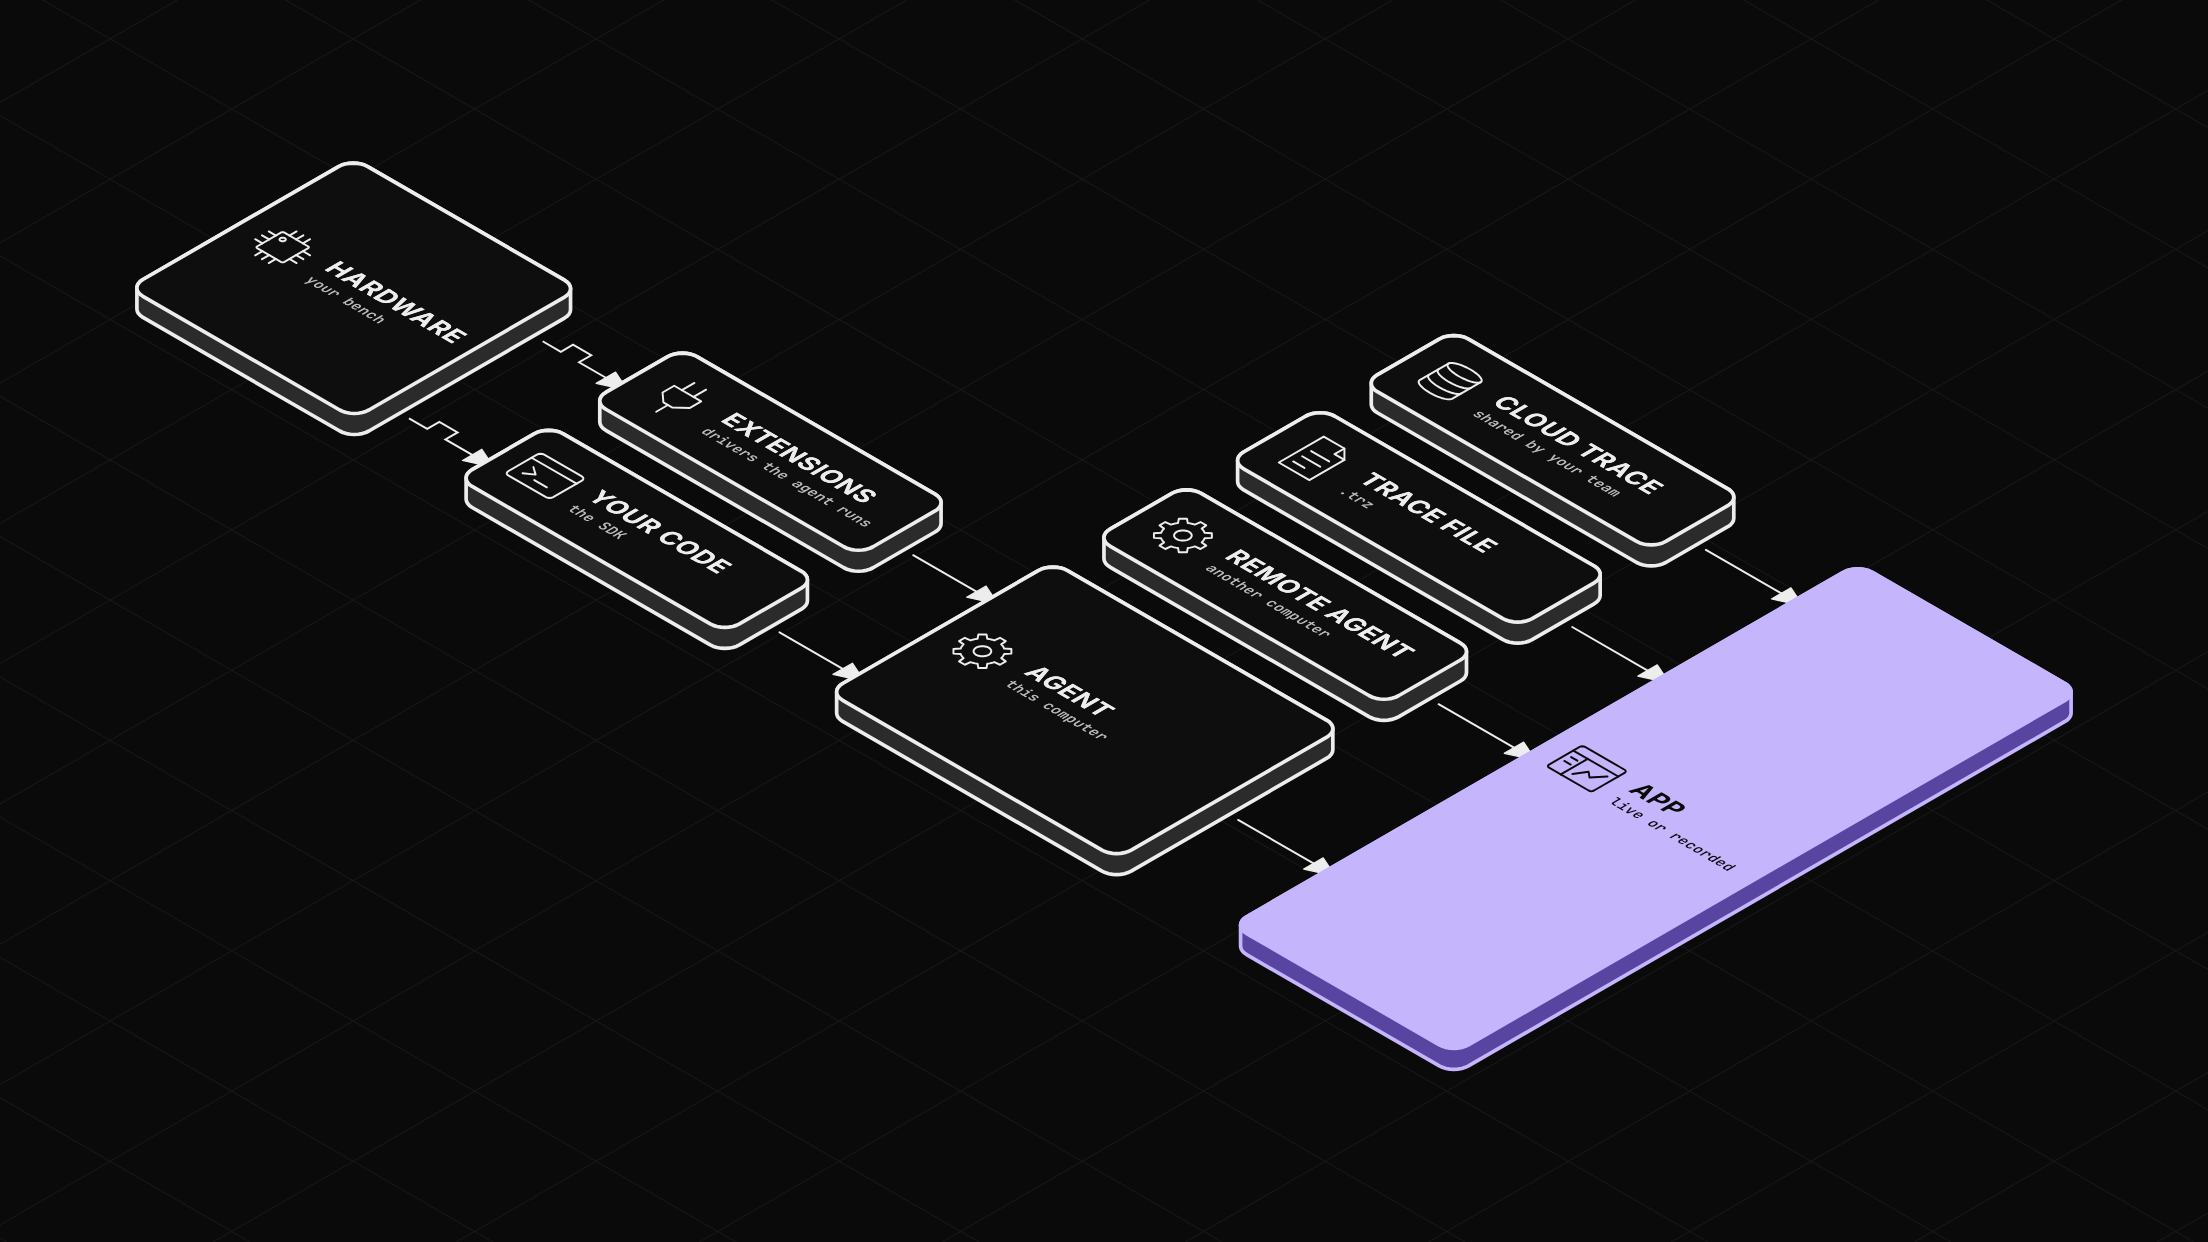
How data reaches the app
Your hardware connects to a Zelos agent: a program that collects signals, such as a cell voltage or a motor speed, each a value over time. Extensions are drivers that the agent runs for your hardware's interfaces, such as a CAN bus. Your own code can also send data to the agent with the SDK (Python, Rust or Go). The app shows what the agent collects, live or recorded.
The app runs its own agent on your computer, named localhost. It can also connect to an agent on another computer, open a trace file (.trz), or open a cloud trace that your team shared.
Home
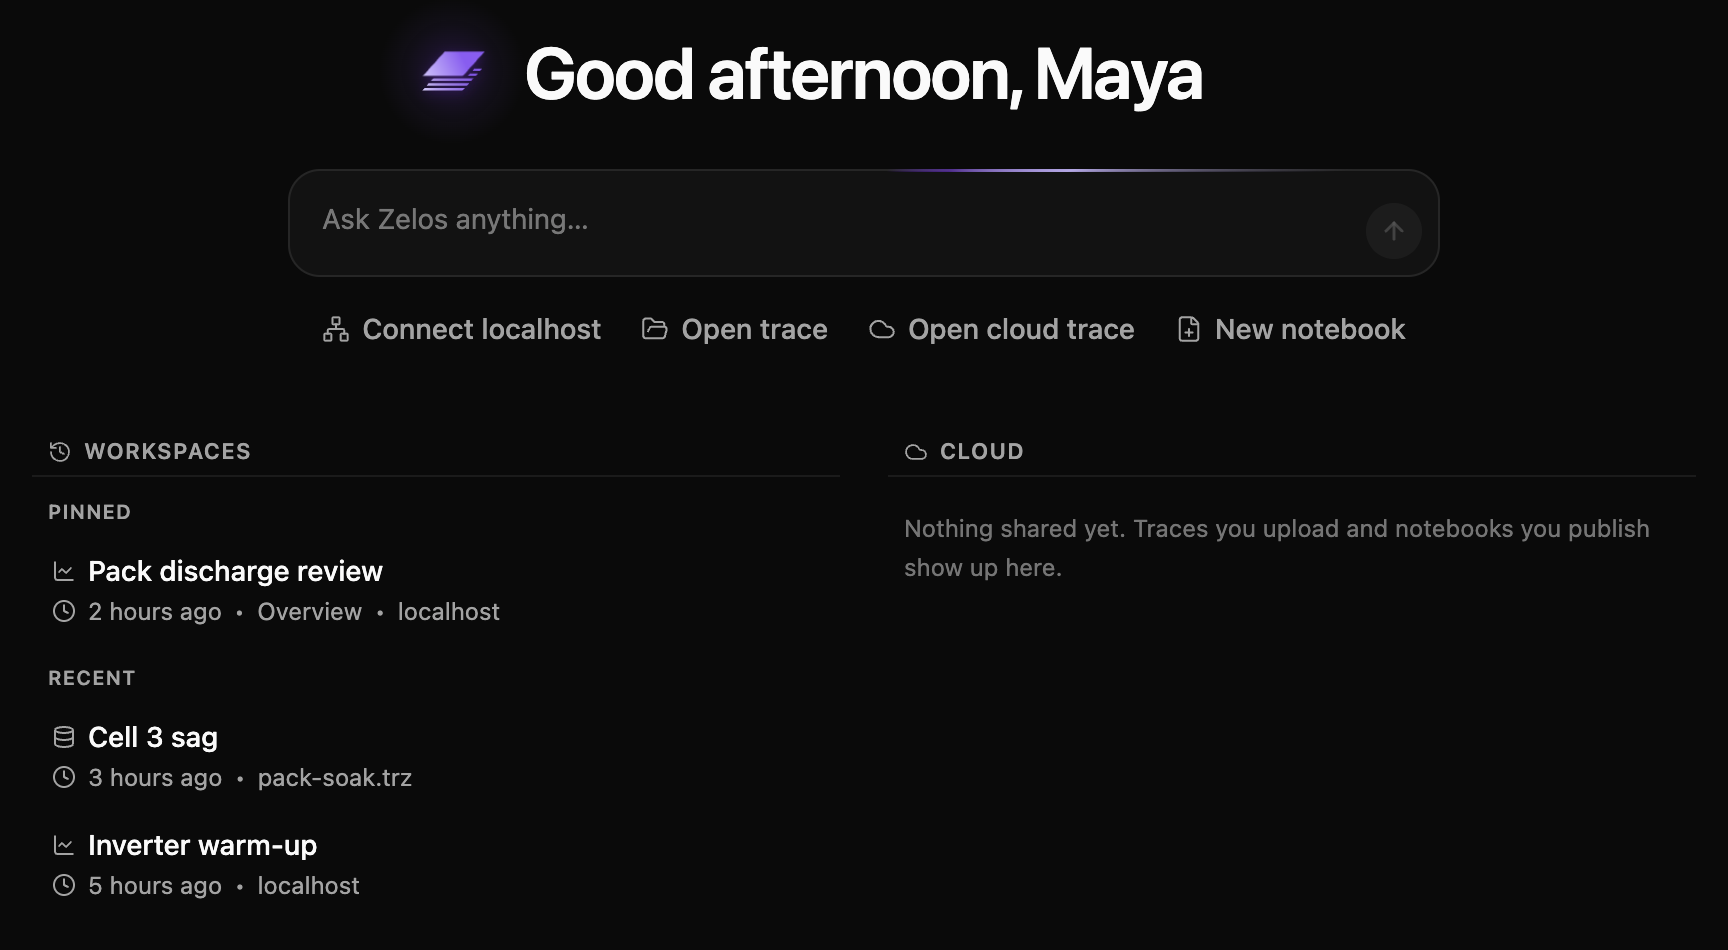
Home is where you start. Its four buttons bring data in: Connect localhost, Open trace, Open cloud trace and New notebook. You can also drop a .trz file on Home to open it. Workspaces lists your past work, pinned ones on top; click one to open it again. Cloud, beside it, lists traces and notebooks your team shared. The box above the buttons sends a question to Zelos AI.
The window
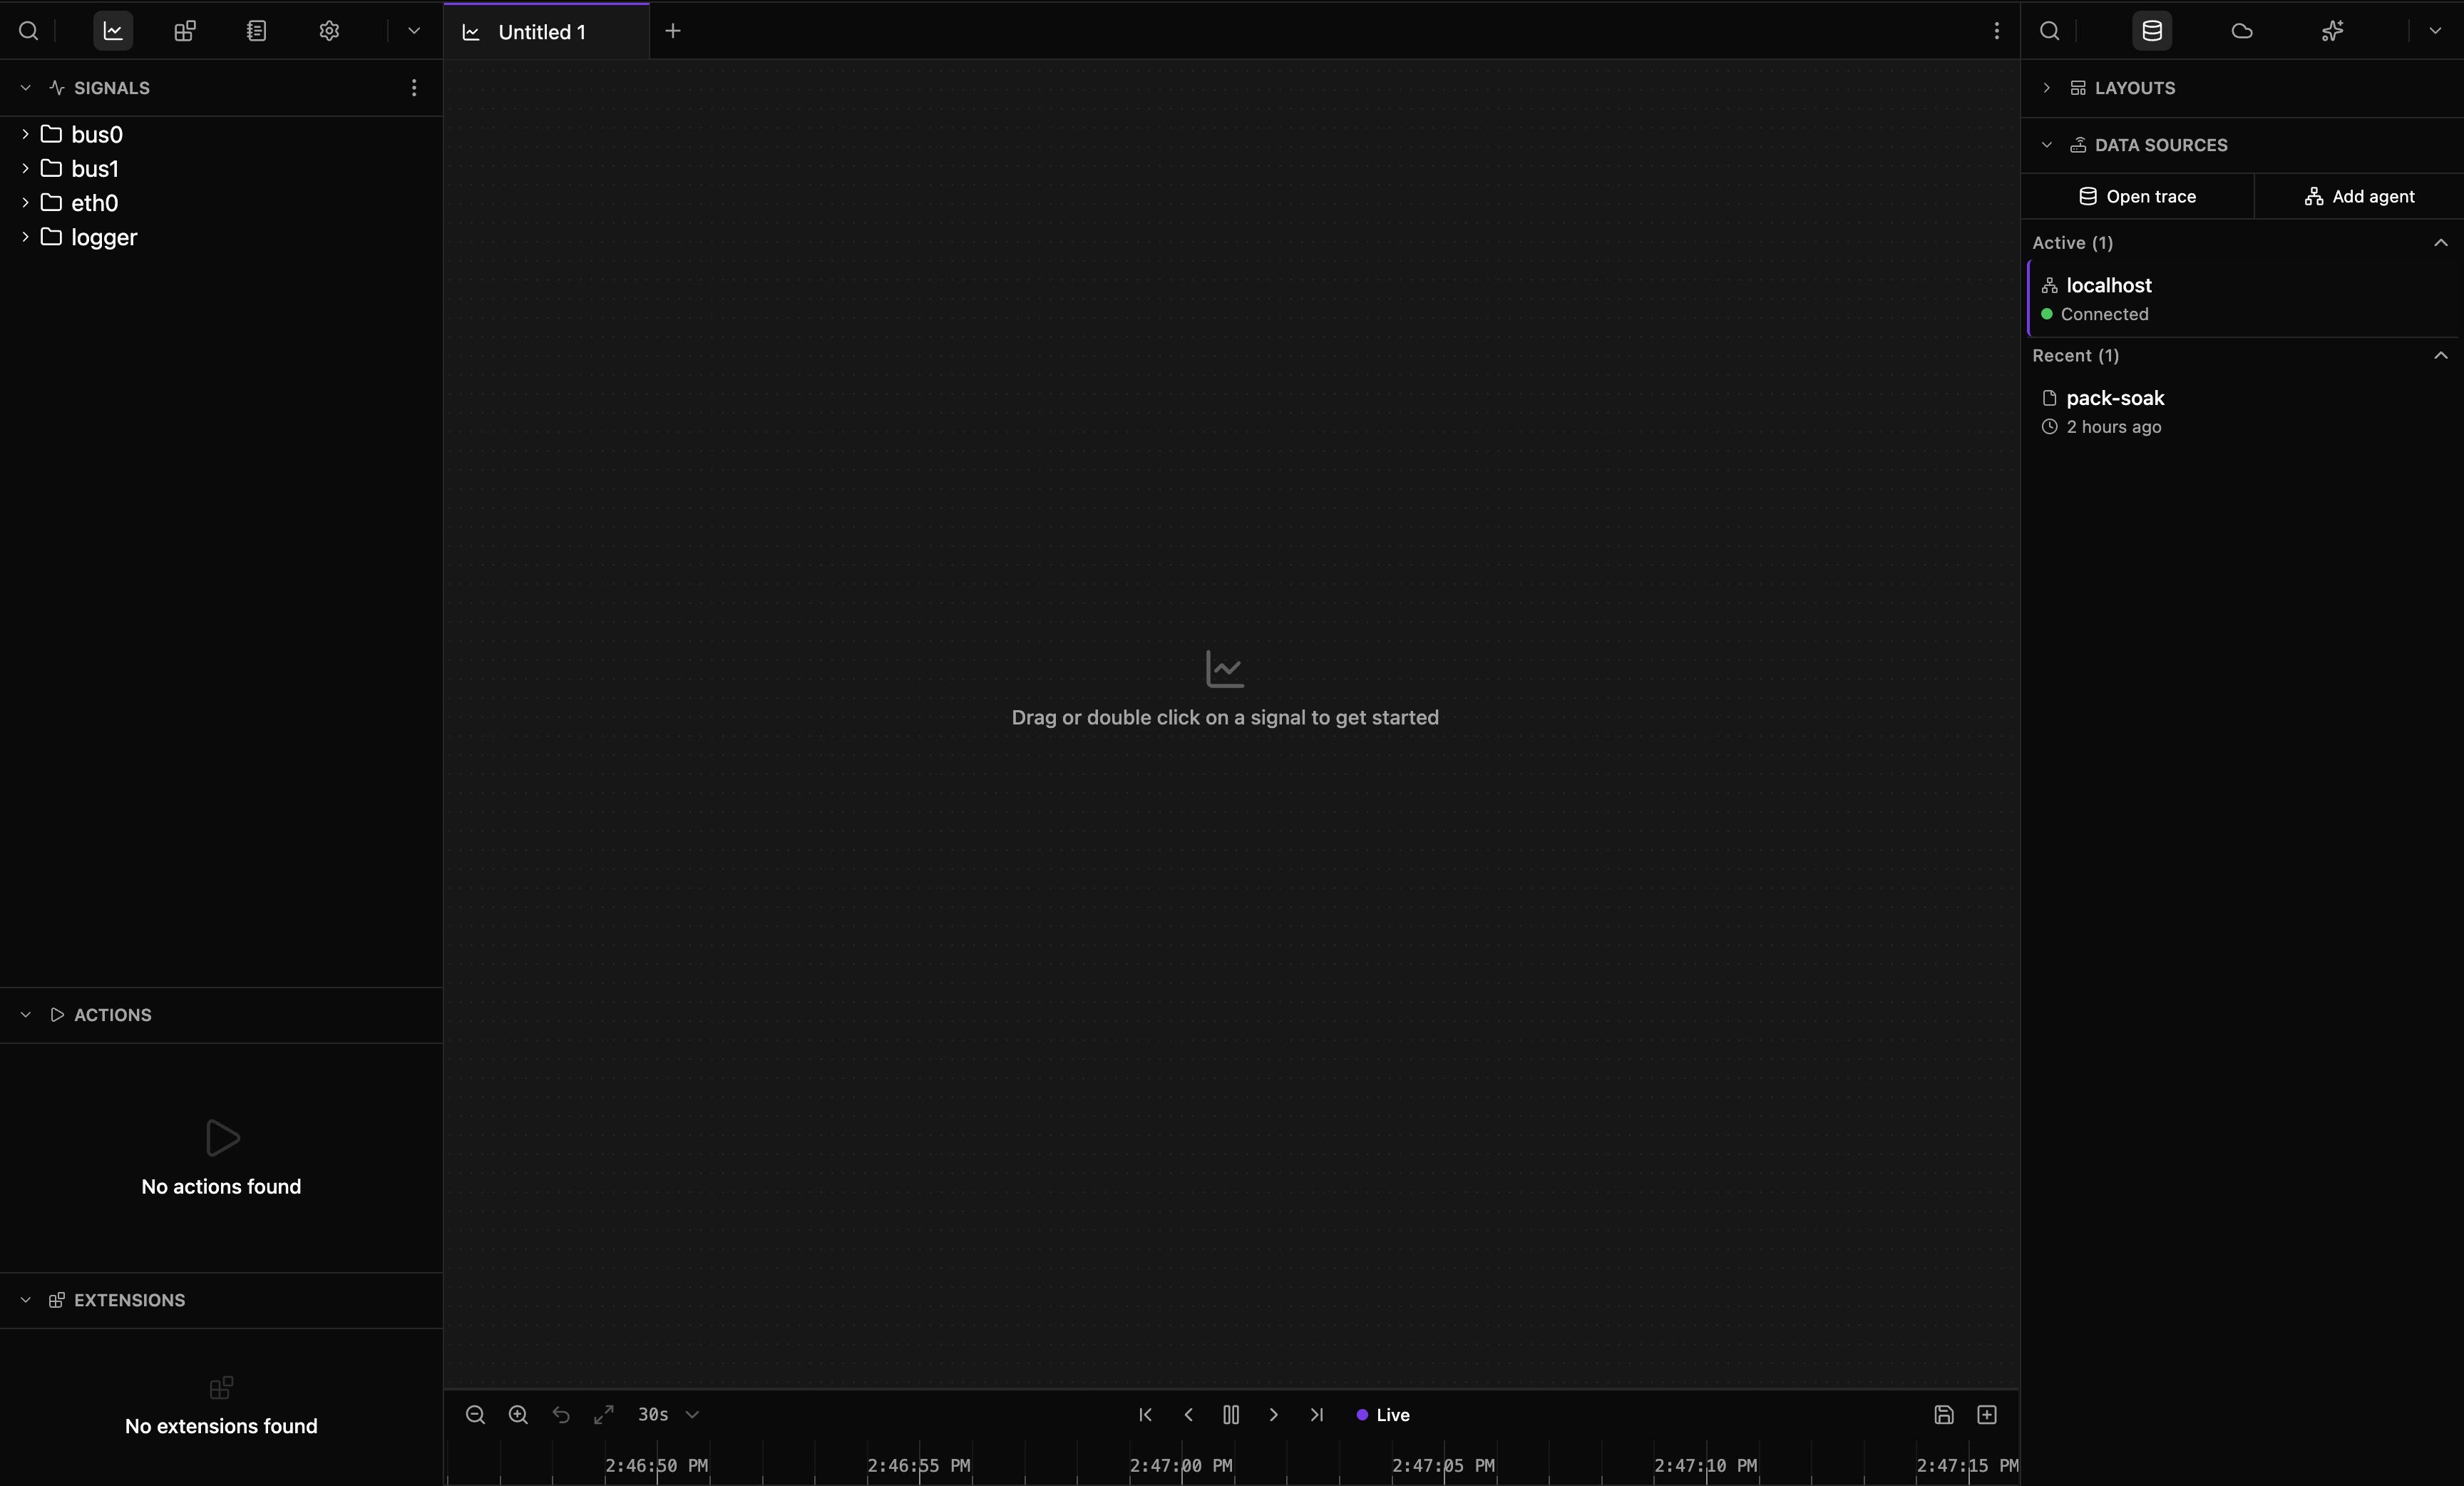
Connect localhost connects to the agent on your computer and opens a tab named Untitled 1. Explorer is on the left, your tabs are in the middle with the timeline under them, and Data is on the right. Each sidebar has a rail of icons along its top, and each icon is a view.
Data sources
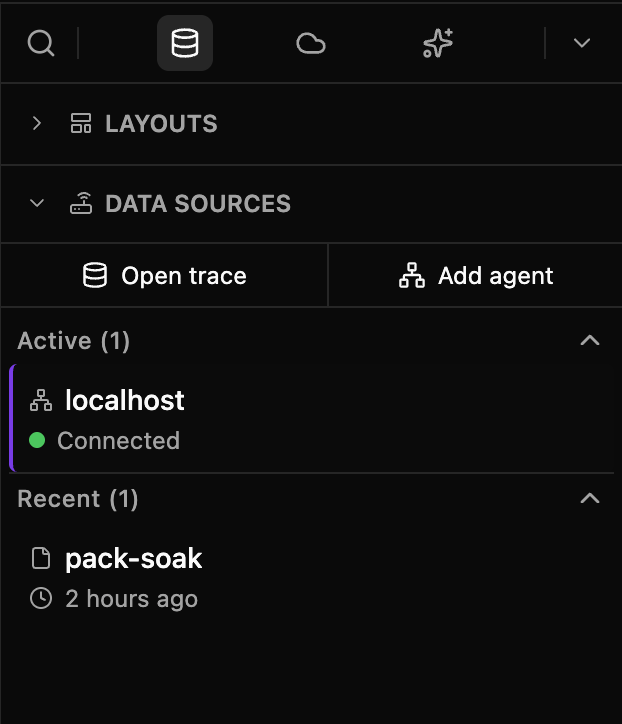
Data lists every source you have used: agents, trace files and cloud traces, under Active, Pinned and Recent. Open trace opens a trace from a File or from the Cloud. Add agent connects to an agent on another computer by its host name; that needs a paid plan.
Explorer
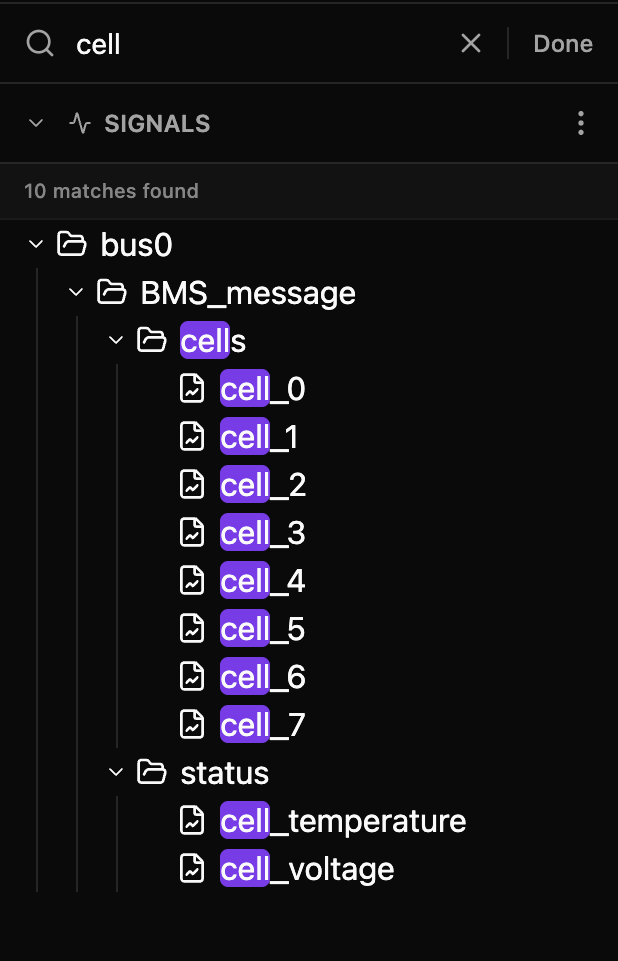
Explorer lists every signal that the open sources have, as a tree: source, message, signal. Below it, ACTIONS lists the agent's actions (Run actions on your bench from the app), and EXTENSIONS lists the extensions it runs.
Press Cmd+F (Ctrl+F on Windows and Linux) to search. Search ignores case, and the tree narrows to the matches.
Tabs and panels
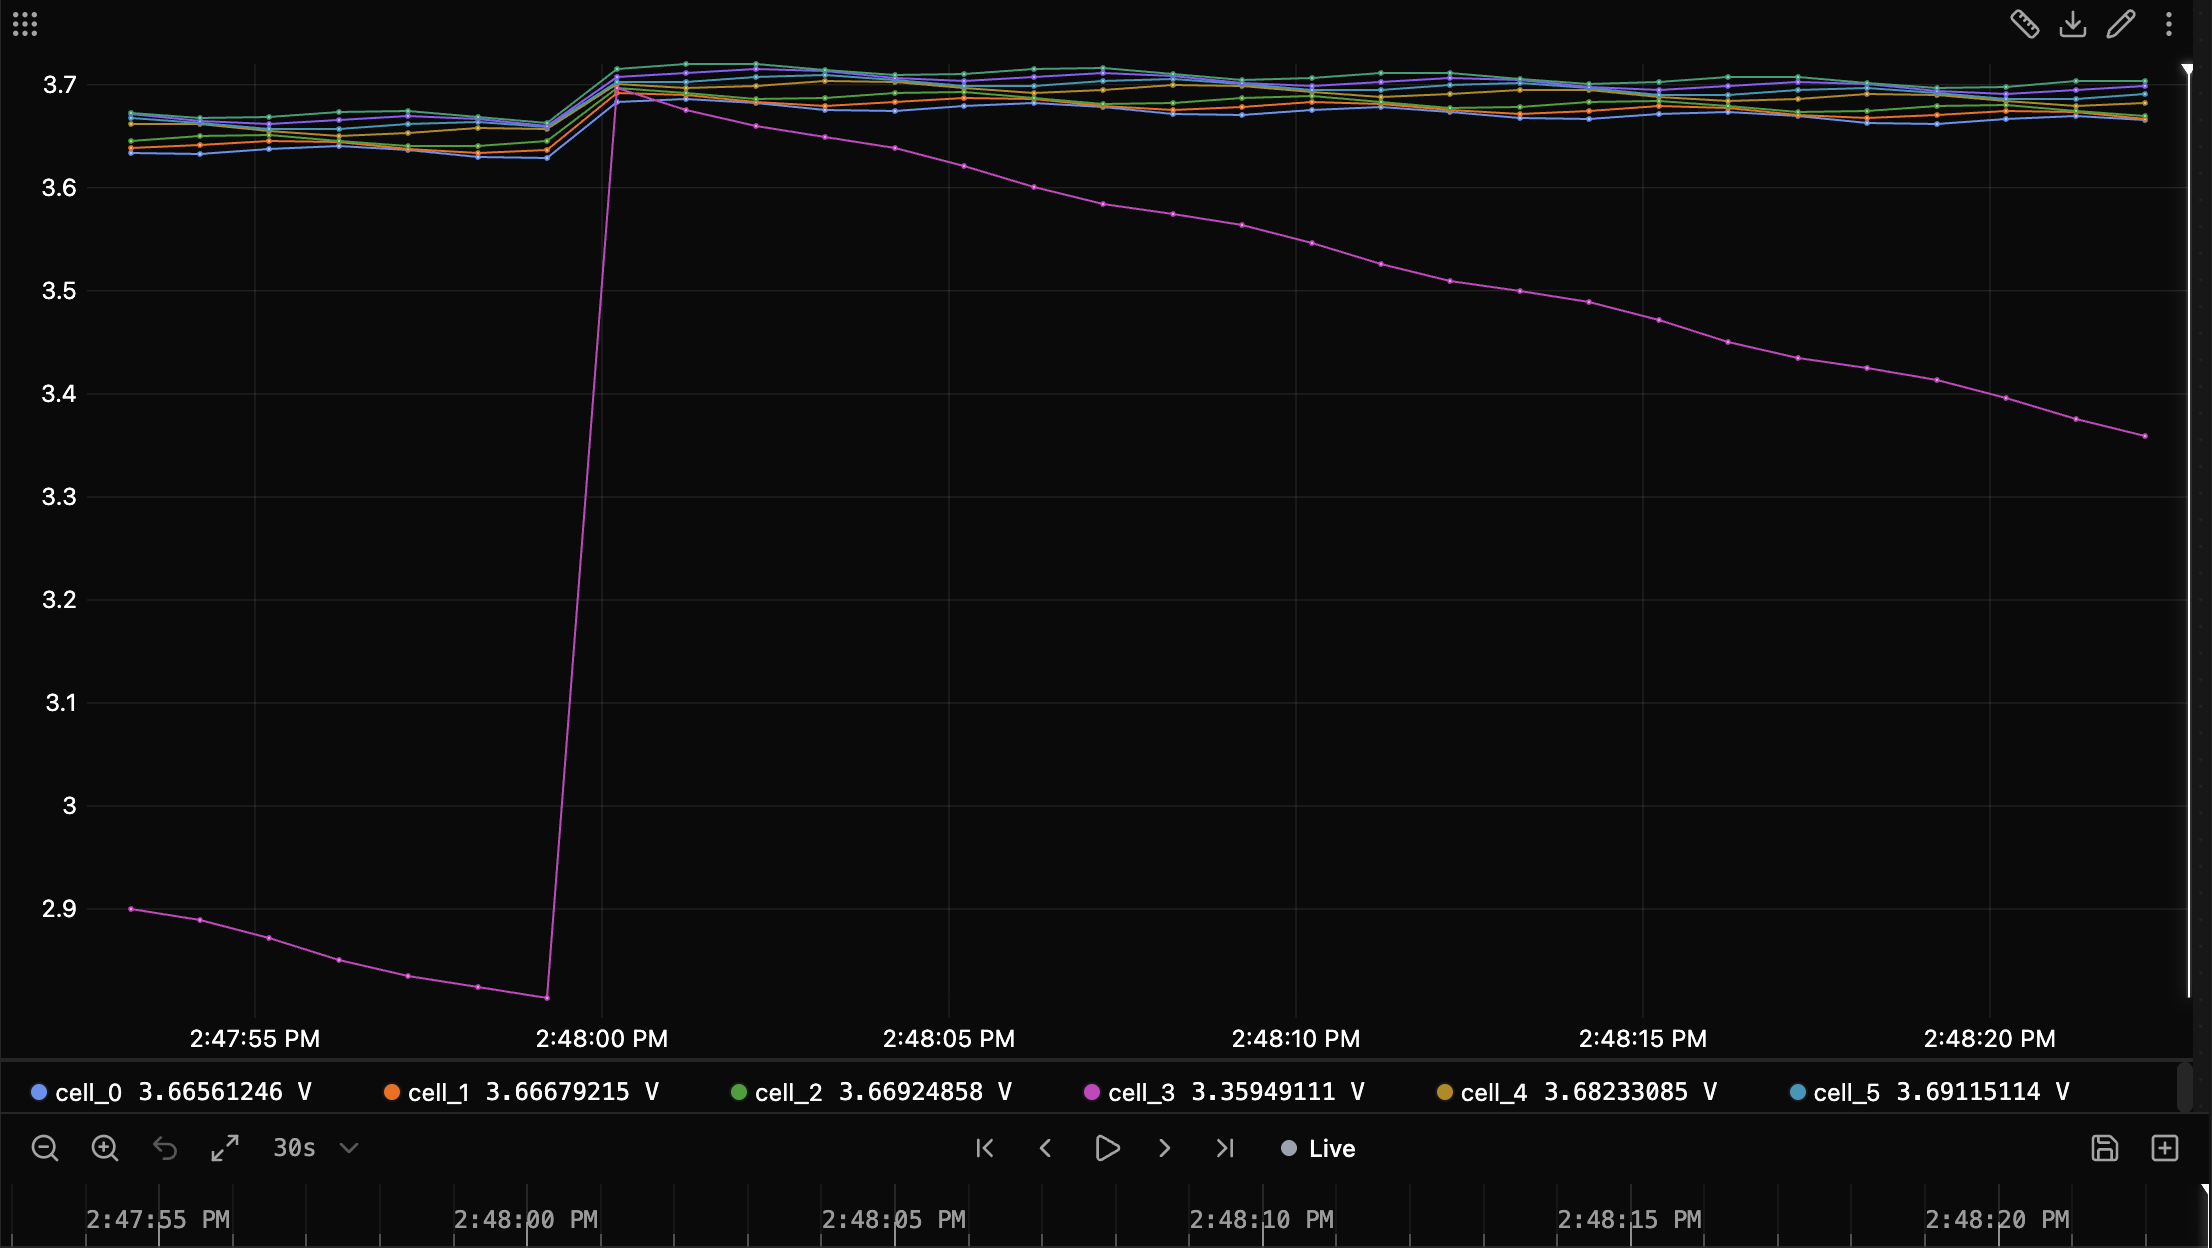
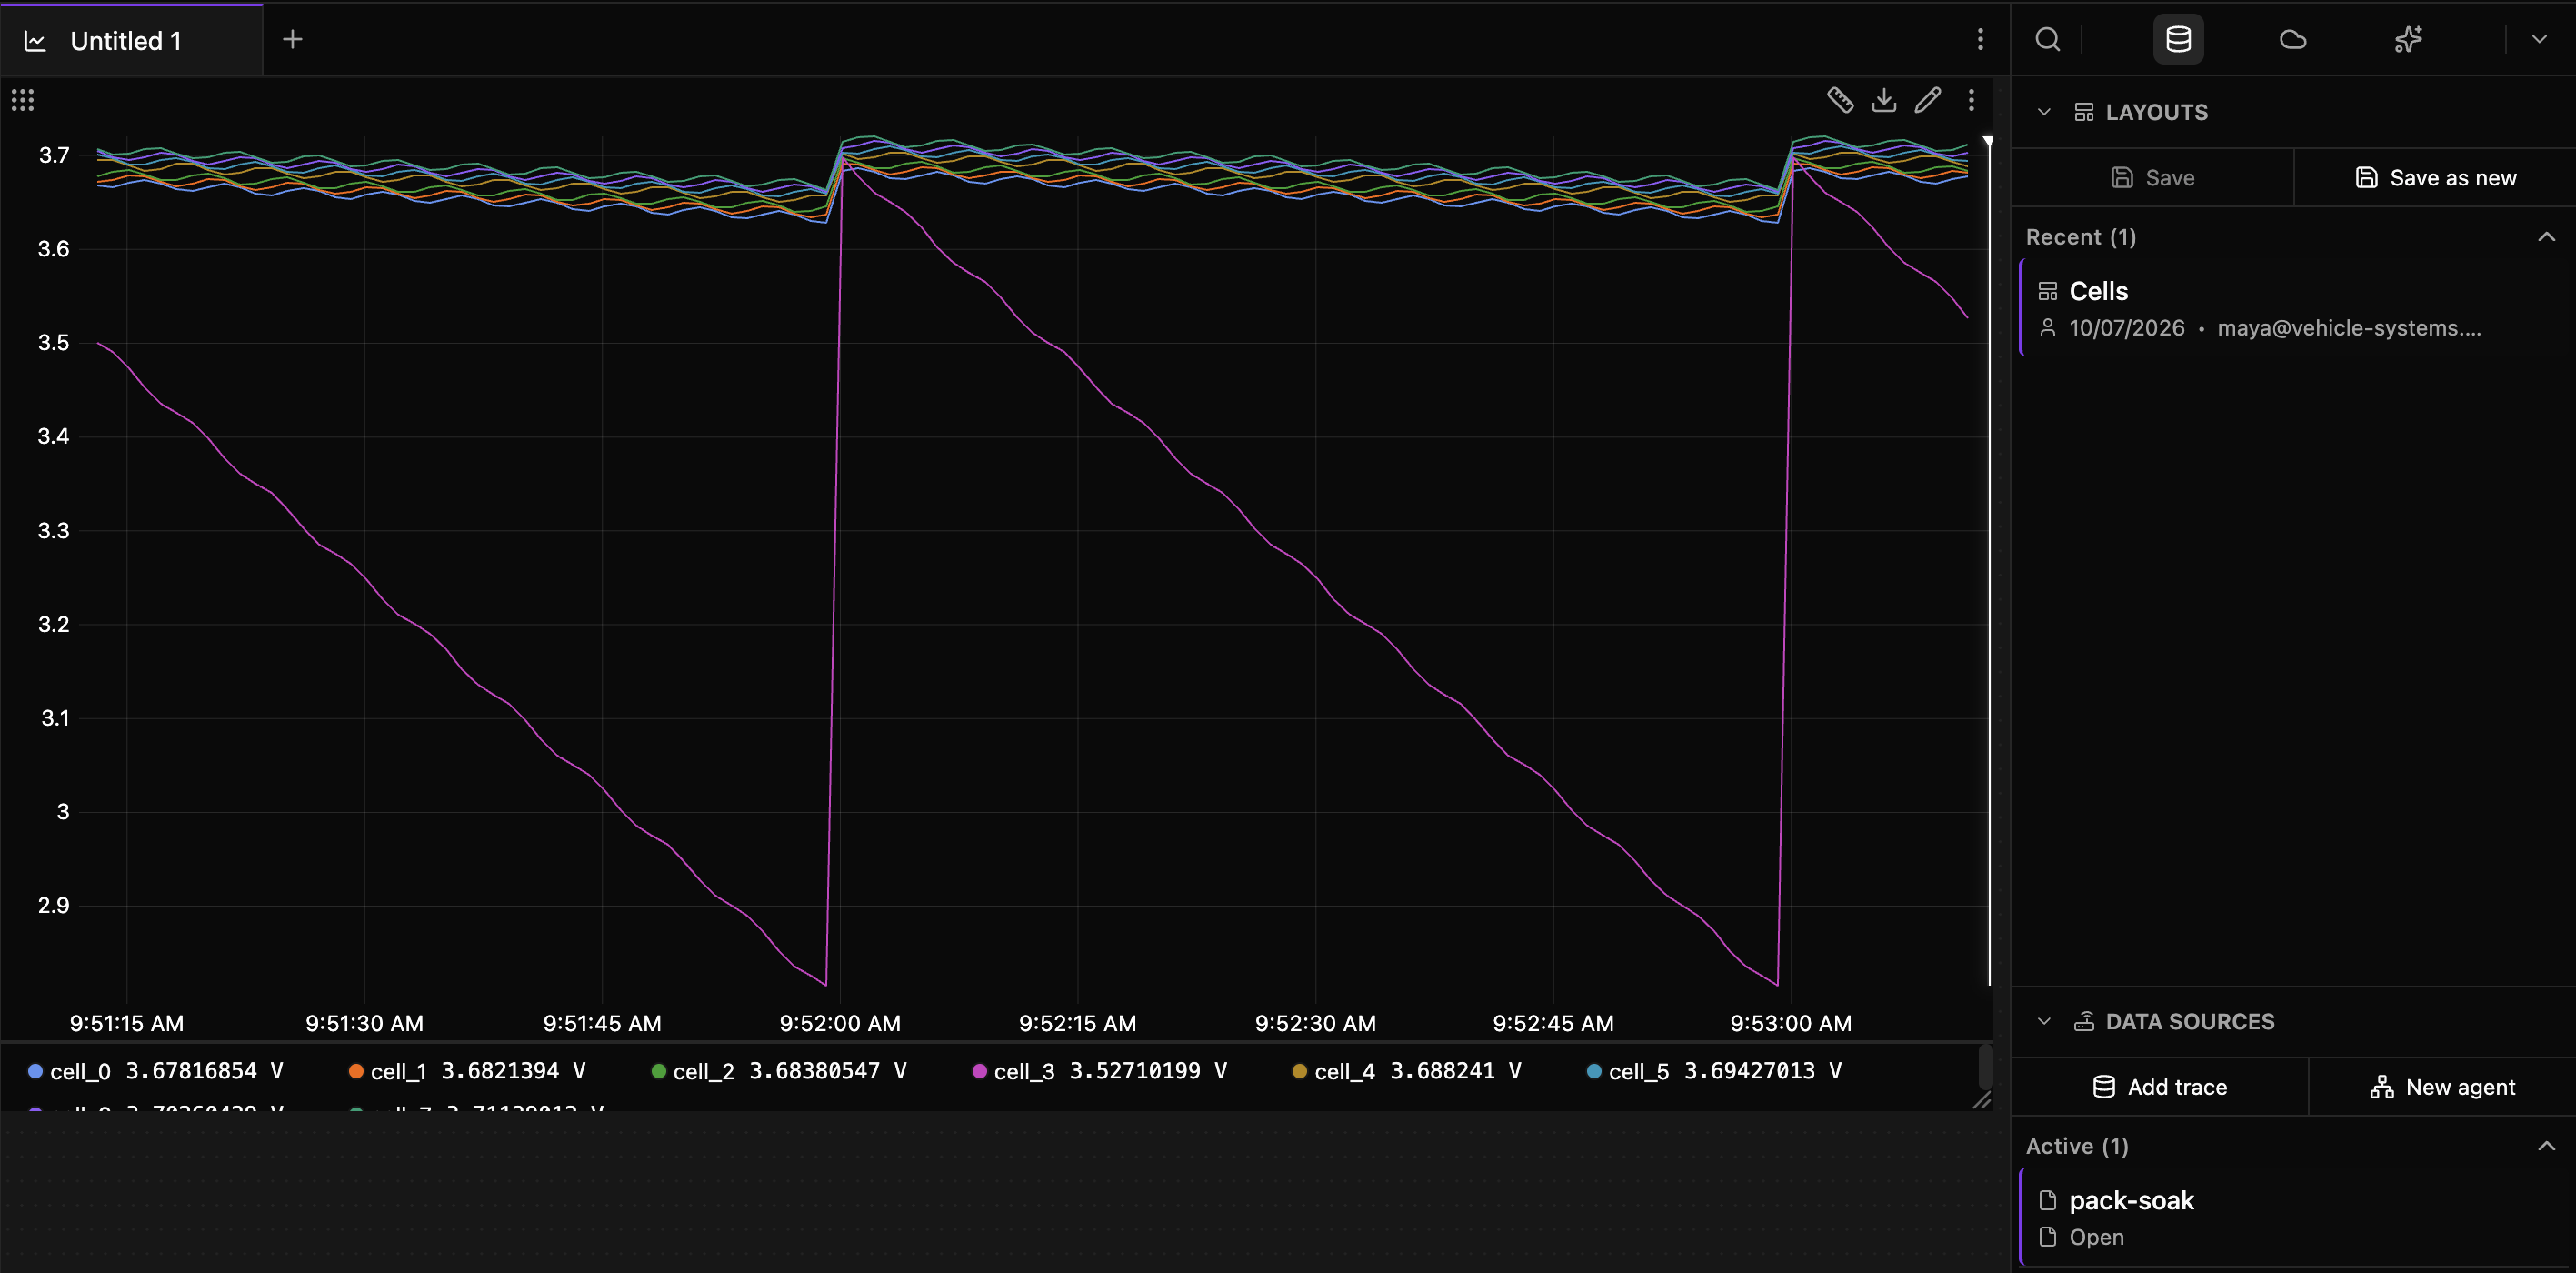
A tab holds panels. Drag a signal from Explorer into a tab, or double-click it, and you get a plot. Drag a message, such as cells, and all of its signals go on one plot. Add panel, at the right end of the timeline, adds the other kinds of panel. The + in the tab bar opens another tab. Pick the right panel for each signal shows each kind.

The timeline
A live tab shows the last 30 seconds, and new data scrolls in from the right. Pause (or Space) holds the view still, and the agent keeps collecting. Drag along the timeline to go back in time; that also pauses. Live (or Esc) brings you back to the newest data. The window button, 30s, sets how much time you see, from 30 seconds to 24 hours. Pause live data, measure a change, and compare two runs goes further.
Save a trace
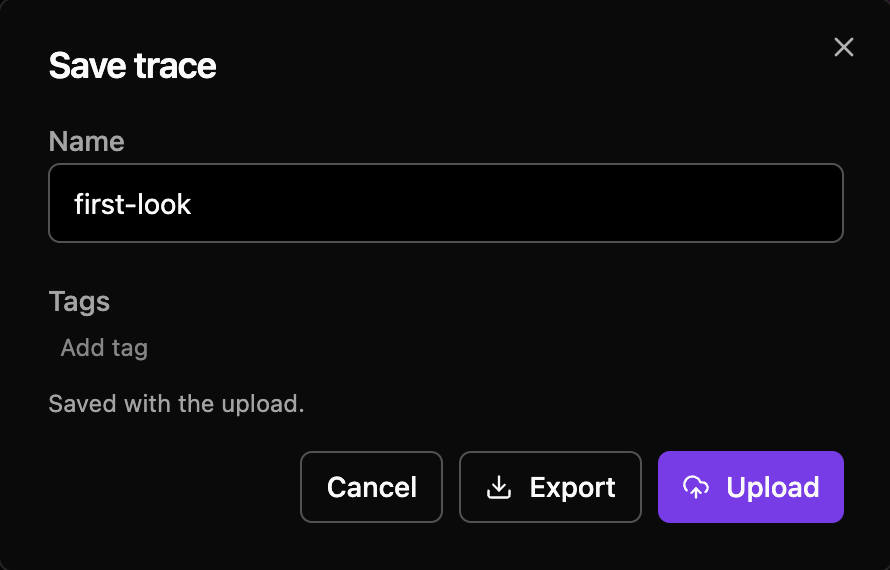
By default, the agent on your computer keeps the last 8 hours in memory, and that data is gone when the app quits. Save trace, at the right end of the timeline, keeps a copy. Upload sends it to your team in Zelos Cloud, on any plan. Export writes a local .trz file and needs a paid plan. While live, it saves the current window; while paused, the window you see.
Layouts
A layout keeps your view without the data: your tabs, their panels, and the signals in them. You can load it on any run that has the same signals. In Data, open LAYOUTS, choose Save as new, type a name, and choose Save. Then open another source, such as a trace file, and click the layout's name. Your tabs come back, filled with that source's data. Build a view once and reuse it on every run goes further.
The other views
| View | Rail | What it is for |
|---|---|---|
| Explorer | Left | Signals, actions and extensions of the open sources. |
| Extensions | Left | Install, configure and run extensions from the marketplace. Connect your hardware's protocol. |
| Notebooks | Left | Notes and Python code that work on your data. Write your first notebook. |
| Settings | Left | The app's settings, in a tab. |
| Data | Right | Data sources and layouts. |
| Cloud | Right | Traces and notebooks your team shared. Publish a notebook. |
| AI Chat | Right | Zelos AI, which answers questions about your data. |
Press Cmd+K (Ctrl+K) to open the command palette, then type the name of any command.
Safe to click around
Pausing, switching views and closing tabs leave the agent's data alone. A closed tab comes back with Undo in the toast, or with Cmd+Shift+T (Ctrl+Shift+T). Live brings you back to now, and closing every tab brings back Home.
Next: a panel for each signal
Pick the right panel for each signal shows which panel suits which data. The app docs cover every view and command.